
- Title
-
Identification of genes expressed by zebrafish oligodendrocytes using a differential microarray screen
- Authors
- Takada, N., and Appel, B.
- Source
- Full text @ Dev. Dyn.
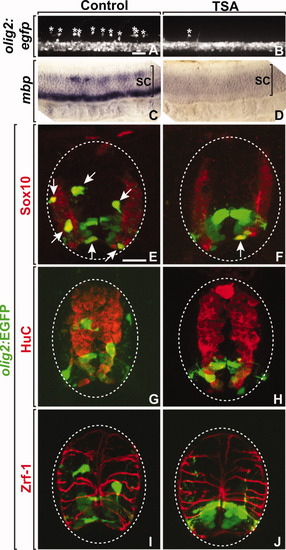
HDAC inhibitor TSA blocks oligodendrocyte formation. Embryos were treated with TSA from 36 hours postfertilization (hpf) to 3 days postfertilization (dpf). A,C,E,G,I: Controls. B,D,F,H,J: Trichostatin A (TSA) treated. A-D: Lateral views of the spinal cord. E-J: Transverse sections of the spinal cord of Tg(olig2:egfp) larvae. A,B: Images of the spinal cord of living Tg(olig2:egfp) larvae at 3 dpf. Asterisks indicate dorsally migrated oligodendrocyte progenitor cells (OPCs). C,D: Expression of mbp mRNA at 3 dpf. E,F: Sox10 antibody labeling (red). Arrows indicate Sox10+ olig2:EGFP+ OPCs. G,H: HuC antibody labeling (red) showing neurons. I,J: Zrf-1antibody labeling (red) showing radial glia. Scale bars = 60 μm in A,B, 15 μm in E-J. SC, spinal cord; EGFP, enhanced green fluorescent protein. EXPRESSION / LABELING:
|
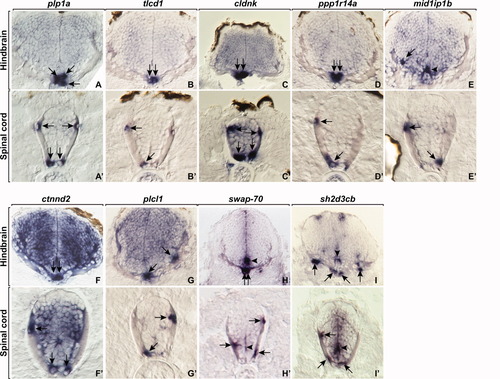
RNA expression patterns of genes in hindbrain and spinal cord at 4 days postfertilization (dpf). plp1a expression marks differentiating oligodendrocytes. A-I′: Panels show transverse sections of hind brain (A-I) and spinal cord (A′-I′). Arrows indicate expression in oligodendrocytes and arrowheads indicate expression in precursors near the central canal. EXPRESSION / LABELING:
|
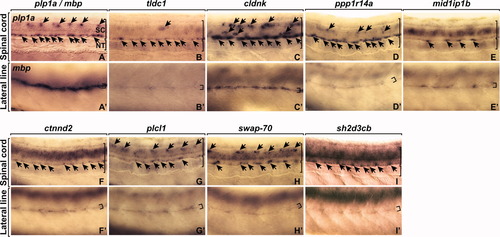
RNA expression patterns of genes in spinal cord and lateral line at 4 dpf. plpa1 and mbp expression marks differentiated oligodendrocytes and Schwann cells. A-I′: Panels show lateral views of spinal cord (A-I) and lateral line (A′-I′). Arrows in A-I indicate expression in oligodendrocytes. Small brackets in A′-I′ indicate lateral line nerve. SC, spinal cord; NT, notochord. EXPRESSION / LABELING:
|