
- Title
-
Arterial and venous vessels are required for modulating developmental relocalization and laterality of the interrenal tissue in zebrafish
- Authors
- Chou, C.W., Hsu, H.C., Quek, S.I., Chan, W.K., and Liu, Y.W.
- Source
- Full text @ Dev. Dyn.

The ff1b-expressing interrenal primordia during midline fusion and lateral repositioning. A: Ventral flat mount views of 21-somite (21S), 22-somite (22S), 24-somite (24S), and 26-somite (26S) stage embryos, which were subject to ISH for detecting ff1b mRNA, with anterior oriented to the top. B: The colocalization of steroidogenic activity and ff1b:GFP transgene expression at the interrenal tissue, in the Tg(ff1bEx2:GFP) embryo. Confocal images display the steroidogenic cells as detected by 3&geta;Hsd activity staining (a,b), and the green fluorescence driven by ff1b promoter (a′,b′), in a Tg(ff1bEx2:GFP) embryo at 32 hpf. The merged images of 3 μ-Hsd activity staining and GFP are shown in a″,b′. a-a″: Dorsal views with anterior to the top; (b-b″) dorsolateral views with anterior to the right. C: Confocal time-lapse imaging of the interrenal tissue in a live Tg(ff1bEx2:GFP) embryo. A dechorionated embryo at around 21-somite stages was mounted with the dorsal side up in 3% methyl cellulose. The fluorescent images were collected at 1-min intervals, and representative frames are shown. The last frame of the time series is a merge of fluorescent and bright-field images. Time is indicated by hours:minutes. Since the sample was kept at 23°C during observation, developmental stages cannot be accurately addressed. Each fluorescent image in B and C represents a projection of a consecutive z-stack encompassing the depth of the interrenal tissue. Both ISH and time-lapse ff1b:GFP analyses show that the interrenal primordia fuse at the midline prior to the lateral relocalization. Red arrows indicate ff1b-expressing interrenal primordia in A, and the ff1b promoter-driven interrenal-specific fluorescence in C. S2, S3, and S4, the second, third, and fourth somite, respectively. White arrowheads in C indicate ectopic GFP expression in muscle pioneer cells. White dotted lines indicate the position of the midline. Scale bar = 50 μM. EXPRESSION / LABELING:
|

Effects of the ets1b antisense morpholino injection on the interrenal tissue and its neighboring vasculature. Confocal sections showing the interrenal tissue as detected by 3 β-Hsd activity staining (A-E), and the neighboring endothelium as labeled by green fluorescence (A′-E′), of 2-dpf Tg(fli1:EGFP)Y1 embryos uninjected (A), injected with ets1bMO (B-D), or with tnnt2MO (E), respectively. A″-E″: The merged images of 3 β-Hsd activity staining and GFP. A-E are dorsal views with anterior oriented to the top. F: The merged image of 3 β-Hsd staining and GFP of the same embryo as in E-E″, a lateral view with anterior to the left. B-B″, C-C″, D-D″: Classes I to III of interrenal phenotypes in the ets1b morphant, where the trunk endothelium was reduced and the axial vascular formation inhibited. Vascular ECs, but not the blood flow, are required for the convergence and laterality of the interrenal tissue. Yellow dotted lines indicate the position of the midline. Orange arrows, interrenal tissues; yellow arrowheads, angiogenic glomerulus; DA, dorsal aorta; PCV, posterior cardinal vein; ISV, intersegmental vessel. Scale bar = 50 μM. |

Effects of the hey2 antisense morpholino injection on the interrenal tissue and its neighboring vasculature. A: Ventral flat-mount views showing the effects of hey2MO on the expressions of eph-B2a and flt4 in the peri-interrenal region. Uninjected control (a,c) and injected embryos (b,d) were fixed at 35 hpf, and two-color ISH were carried out to detect the expression of ff1b together with either eph-B2a (a,b) or flt4 (c,d). a-d: Oriented with anterior to the top. B: Confocal images display the interrenal tissue as detected by 3 β-Hsd activity staining (left panels, a-f), and the neighboring endothelium as labeled by green fluorescence (middle panels, a′-f′), of 34-hpf (a,b) and 54-hpf (c-f) Tg(kdrl:EGFP)s843 embryos uninjected (a-d) or injected with hey2 antisense morpholino (e,f). The merged images of 3 β-Hsd activity staining and GFP are shown in the right panels (a″-f″). Each fluorescent image depicting the vascular morphology represents a projection of a consecutive z-stack encompassing the depth of the interrenal tissue. a-a″, c-c″, e-e″ are dorsal views with anterior oriented to the top, while b-b″, d-d″, f-f″ are dorsolateral views with anterior to the right. Relocalization and right-sided laterality of the interrenal tissue is perturbed upon the disruption of axial artery in the hey2 morphant. Black and orange arrows indicate the ff1b-expressing and steroidogenic interrenal tissues, respectively. Red and blue arrowheads denote the arterial and venous vasculature, respectively. Yellow and blue dotted lines, boundaries of arterial and venous structures, respectively; white dotted lines, position of the midline; DA, dorsal aorta; ISV, intersegmental vessel; PCV, posterior cardinal vein; DC, duct of Cuvier; G, glomerulus; IR, interrenal tissue. Scale bar = 50 μM. |
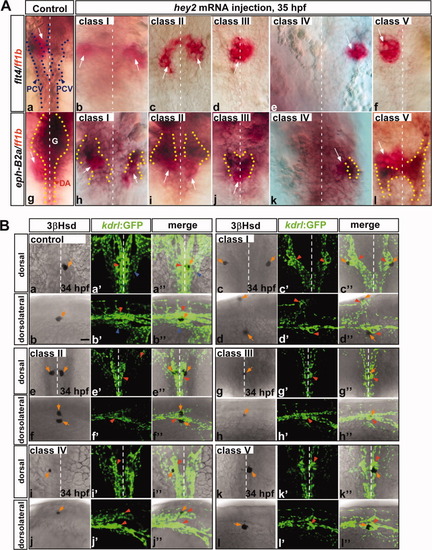
Effects of hey2 mRNA injections on the interrenal tissue and its neighboring artery and vein. A: Effects of hey2 mRNA on the expressions of flt4 and eph-B2a in the peri-interrenal region. Uninjected control (a, g) and injected embryos (b-f, h-l) were fixed at 35 hpf and subject to two-color ISH for detecting the expression of ff1b together with that of either flt4 (a-f) or eph-B2a (g-l). All panels in A are ventral views with anterior oriented to the top. The flt4 expression at the peri-interrenal area is absent in all phenotypic classes of injected embryos (classes I-V). B: Sets of confocal images display the interrenal tissues as detected by 3 β-Hsd activity staining (left panels of each set, a-l), and the neighboring endothelium as labeled by green fluorescence (middle panels of each set, a′-l′), of 34-hpf Tg(kdrl:EGFP)s843 embryos uninjected (a, b) or injected with hey2 mRNA (c-l, classes I-V). The merged images of 3 β-Hsd activity staining and GFP are shown in the right panels of each set (a″-l″). Each fluorescent image depicting the vascular morphology represents a projection of a consecutive z-stack encompassing the depth of the interrenal tissue. a, c, e, g, i, k are dorsal views with anterior oriented to the top, while b, d, f, h, j, l are dorsolateral views with anterior to the right. The venous endothelium at the peri-interrenal area is severely reduced in all classes of hey2 mRNA-injected embryos, which is accompanied by various expressivities of the interrenal morphogenetic defect. White and orange arrows, ff1b-expressing and steroidogenic interrenal tissues; red and blue arrowheads, artery and vein, respectively; blue and yellow dotted lines, boundaries of venous and arterial structures, respectively; white dotted lines, position of the midline; DA, dorsal aorta; PCV, posterior cardinal vein; G, glomerulus. Scale bar = 50 μM. EXPRESSION / LABELING:
|