
- Title
-
Prickle1b mediates interpretation of migratory cues during zebrafish facial branchiomotor neuron migration
- Authors
- Mapp, O.M., Wanner, S.J., Rohrschneider, M.R., and Prince, V.E.
- Source
- Full text @ Dev. Dyn.

zCREST1:membRFP transgenic line allows enhanced visualization of cell shape and protrusions in FBMNs. A: zCREST1:membRFP transgene. Expression of membrane-targeted RFP was driven by branchiomotor neuron-specific zCREST1 enhancer of the islet1 promoter. B-D: Dorsal views of live zCREST1:membRFP; islet1:GFP double-transgenic 24 hpf embryos. B: zCREST1:membRFP transgene expression is limited to branchiomotor neurons, as well as a subset of cells in the otic vesicle (yellow arrowheads). C: islet1:GFP transgene. D: Merged images. D: Higher magnification view of region enclosed by yellow box in D, highlighting protrusions visible with membRFP expression (white arrowheads). EXPRESSION / LABELING:
Construct:
Tg(en.crest1-hsp70l:mRFP)
|
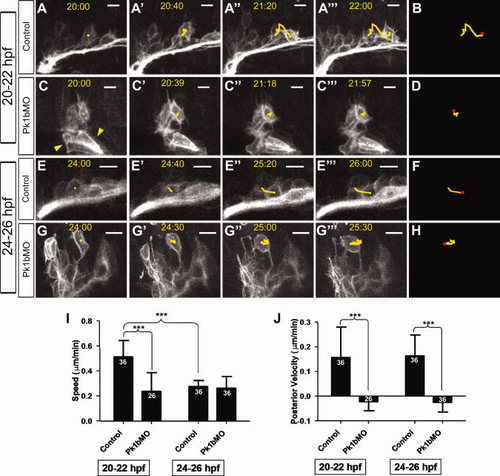
Pk1b deficiency alters both overall speed and posterior-directed velocity of FBMN migration. A, C, E, G: Frames from time-lapse movies of zCREST1:membRFP embryos, showing movements of FBMNs. A-A: Control, 20-22 hpf. C-C: Pk1b morphant, 20-22 hpf. E-E: Control, 24-26 hpf. G-G: Pk1b morphant, 24-26 hpf. Scale bars = 10 m. Note that there are membRFP-positive cells in otic vesicle (yellow arrowheads). B, D, F, H: Yellow lines represent cumulative movements of cells tracked in A, C, E, and G, respectively. Pink dots correspond to final position of tracked neurons during the course of the time-lapse analysis. I,J: Average FBMN speed (I) and posterior-directed velocity (J) was measured over the course of time-lapse movies. Numbers above each bar indicate the number of cells tracked (n). N = 3 embryos for each class. Scale bars = 10 m. *P < 0.05; **P < 0.01; ***P < 0.001. EXPRESSION / LABELING:
PHENOTYPE:
|

ZFIN is incorporating published figure images and captions as part of an ongoing project. Figures from some publications have not yet been curated, or are not available for display because of copyright restrictions. PHENOTYPE:
|

FBMN length-width ratio (LWR) is altered in Pk1b morphants. A-D: Dorsal views of fixed embryos highlighting differences in cell shape and orientation along migratory path. A: Control, 18 hpf. B: Pk1b morphant, 18 hpf. C: Control, 24 hpf. D: Pk1b morphant, 24 hpf. Flattened confocal z-stacks. Scale bars = 20 μm. Dashed lines represent rhombomere boundaries, which were assessed by EphA4 immunostaining. E: Schematic explaining LWR measurement. A bisecting line was drawn through the longest axis of each neuron, and another bisecting line was drawn perpendicular to the first. The line that most closely aligned with the A-P axis was defined as the width, while the perpendicular line was defined as the length. If the value of LWR ≈ 1, we considered these cells to be "round". F: Bar graphs summarizing average LWR in each rhombomere at both early and later stages of migration, in control and Pk1b morphant embryos. *P < 0.05; **P < 0.01; ***P < 0.001. EXPRESSION / LABELING:
PHENOTYPE:
|
|
ZFIN is incorporating published figure images and captions as part of an ongoing project. Figures from some publications have not yet been curated, or are not available for display because of copyright restrictions. PHENOTYPE:
|

Centrosome remains primed for tangential migration in Pk1b-deficient neurons. A-D: Dorsal views of fixed embryos illustrating positioning of centrosome in migrating neurons. A: Control, 18 hpf. B: Pk1b morphant, 18 hpf. C: Control, 24 hpf. D: Pk1b morphant, 24 hpf. Red: zCREST1:membRFP transgene expression. Blue: EphA4 immunostaining, to label r3 and r5. Green: Υ-tubulin immunostaining, which allows visualization of centrosomes (bright puncta; white arrowheads) as well as the microtubule network (fainter green staining). Region of each cell with no green staining corresponds to nucleus. Flattened confocal z-stacks. Scale bars = 50 μm. A-D: Higher magnification views of regions denoted by yellow boxes in A-D. E: Schematic demonstrating measurement of centrosome position. A bisecting line was drawn from the centrosome (bright green puncta) through each neuron. The angle of this line, relative to the A-P axis was defined as the centrosome position. F-M: Rose diagrams illustrating the range of centrosome positions in migrating FBMNs. Numbers along right side indicate scale of y-axis (i.e., percentage of total neurons for each angle subset). n values indicated represent total number of neurons scored for each class. N = 5 embryos for each class. EXPRESSION / LABELING:
PHENOTYPE:
|
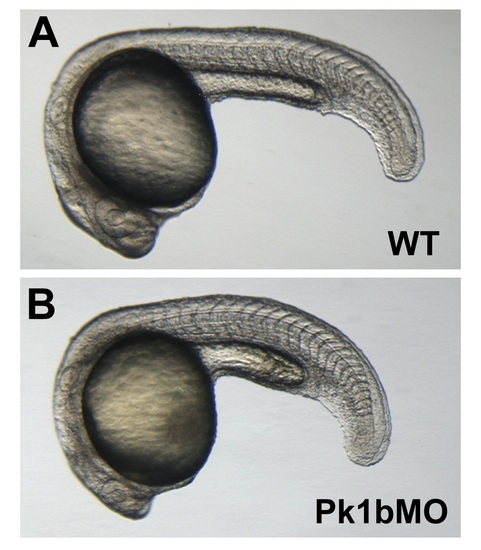
Pk1b morphants have mild convergent extension defects. A, B: Lateral views of 24-hpf WT (A) and Pk1b morphant (B) embryos. PHENOTYPE:
|

PKCζ and PIP3 localization is comparable in control and Pk1b morphant embryos. A, B, E, F: Dorsal views of fixed zCREST1:membRFP transgenic embryos antibody stained for PKCζ (A, E) and PIP3 (B, F). C, D, G, H: Transverse views of fixed zCREST1:membRFP transgenic embryos antibody stained for PKCζ (C, G) and PIP3 (D, H). Embryos were sectioned through r5 (C, D) or r4 (G, H). Scale bar = 20 μm. EXPRESSION / LABELING:
|