
- Title
-
Visualizing enveloping layer glycans during zebrafish early embryogenesis
- Authors
- Baskin, J.M., Dehnert, K.W., Laughlin, S.T., Amacher, S.L., and Bertozzi, C.R.
- Source
- Full text @ Proc. Natl. Acad. Sci. USA
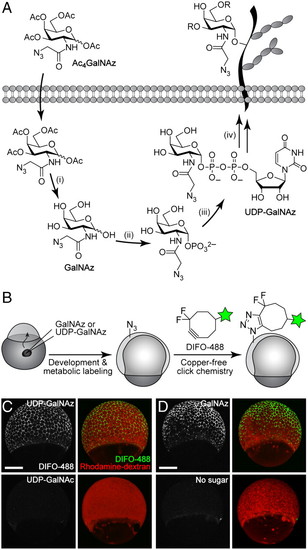
In vivo imaging of glycans in early zebrafish embryos using microinjection of azidosugars and detection with copper-free click chemistry. (A) Metabolic labeling of mucin-type O-glycans with azidosugars via the GalNAc salvage pathway. The enzymatic transformations shown are catalyzed by (i) nonspecific esterases, (ii) GalNAc-1-phosphate kinase, (iii) UDP-GalNAc pyrophosphorylase, and (iv) ppGalNAcTs and other glycosyltransferases. (B) Two-step strategy for imaging glycans in vivo. (C and D) Zebrafish embryos were microinjected with UDP-GalNAz (C, top), GalNAz (D, top), UDP-GalNAc (C, bottom), or no sugar (D, bottom), along with the tracer dye rhodamine-dextran, allowed to develop to 7 hpf, reacted with DIFO-488 (100 μM, 1 h), and imaged by confocal microscopy. Shown are maximum intensity z-projection images. Green, DIFO-488; red, rhodamine-dextran. (Scale bar: 200 μm.) |
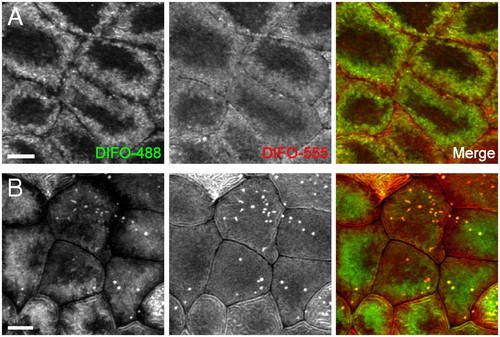
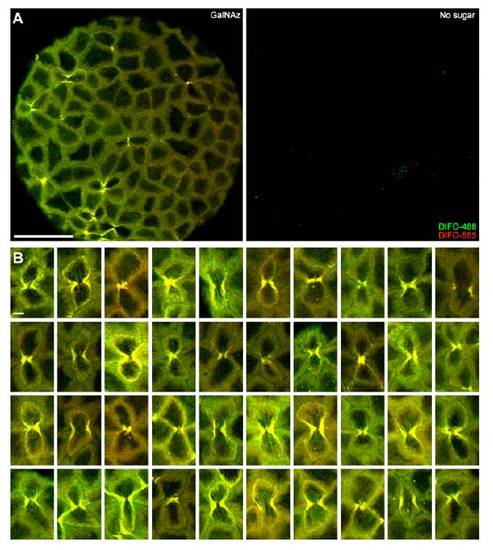
Two-color, time-resolved labeling enables visualization of O-glycan trafficking. Zebrafish embryos were microinjected with GalNAz, allowed to develop to 9 hpf, and reacted with DIFO-488 (100 μM, 1 h). The embryos were then allowed to further develop for 2 h (A) or 12 h (B), at which point they were reacted with DIFO-555 (100 μM, 1 h) and then imaged by confocal microscopy. Shown are maximum intensity z-projection images of superficial enveloping layer cells. Green, DIFO-488; red, DIFO-555. (Scale bar: 10 μm.) |
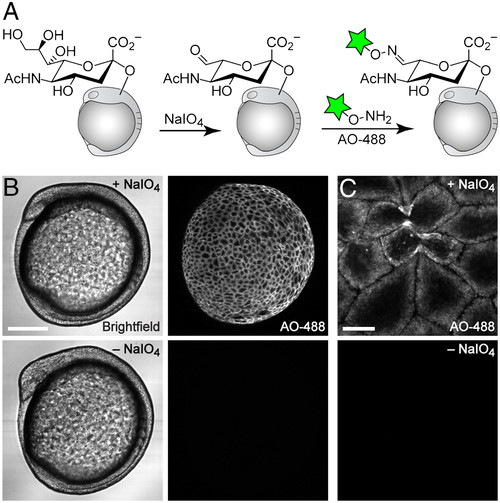
Imaging of sialylated glycans using a nonmetabolic approach. (A) Schematic for chemical labeling of sialylated glycans by treatment with NaIO4 to expose aldehydes on sialic acids, followed by detection using aminooxy-fluorophore conjugates. (B and C) Zebrafish embryos (10 hpf) were bathed in NaIO4 (500 μM, 30 min, top row) or no reagent (bottom row), reacted with aminooxy-Alexa Fluor 488 (AO-488, 100 μM, 1 h, pH 6.7), and imaged by confocal microscopy. (B, left panel) Brightfield; (B, right panel) and (C), maximum intensity z-projection images of AO-488 fluorescence. [Scale bars: 200 μm (B), 20 μm (C).] |
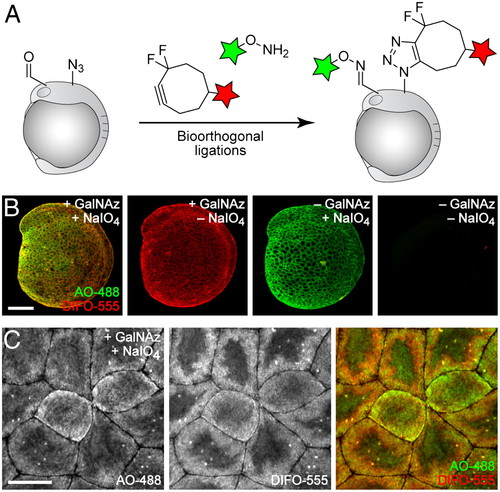
Simultaneous visualization of O-glycans and sialylated glycans using two independent bioorthogonal chemistries. (A) Schematic depicting dual labeling of O-glycans and sialylated glycans. (B and C) Zebrafish embryos were microinjected with GalNAz or no sugar, allowed to develop to 10 hpf, and then bathed in NaIO4 (500 μM, 30 min) or no reagent. Embryos were then reacted in a mixture of DIFO-555 (100 μM) and AO-488 (100 μM) in PBS (pH 6.7) for 1 h, rinsed, and imaged by confocal microscopy. Green, AO-488; red, DIFO-555. [Scale bars: 200 μm (B), 20 μm (C).] |
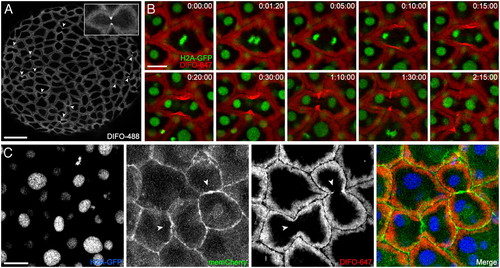
Time-lapse monitoring of mitotic cells reveals dramatic glycan reorganization during cell division. (A) Wild-type zebrafish embryos were microinjected with GalNAz, allowed to develop to 10 hpf, reacted with DIFO-488 (100 μM, 1 h), and imaged by confocal microscopy. Arrowheads indicate intense staining at the cleavage furrow of dividing cells. Maximum intensity z-projection images are shown. (B) H2A-GFP transgenic zebrafish embryos were microinjected with GalNAz and allowed to develop to 10 hpf. The embryos were reacted with DIFO-647 (100 μM, 1 h) and imaged by confocal microscopy. Shown are single z-plane frames from a time-lapse movie (S1). Indicated in the top right corner of each image is time (h:min:s). Green, H2A-GFP; red, DIFO-647. (C) H2A-GFP zebrafish were microinjected at the one-cell stage with GalNAz and memCherry mRNA and allowed to develop to 10 hpf. The embryos were reacted with DIFO-647 (100 μM, 1 h) and imaged by confocal microscopy. Blue, H2A-GFP; green, memCherry; red, DIFO-647. Arrowheads indicate location of new membrane between daughter cells. Maximum intensity z-projection images are shown. [Scale bars: 100 μm (A), 20 μm (B, C).] |
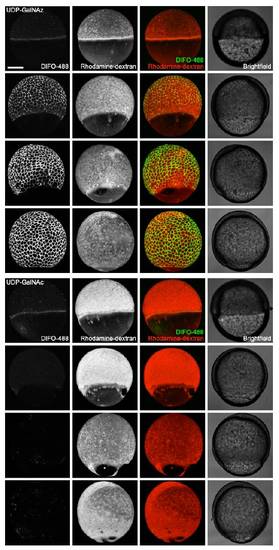
In vivo imaging of glycans during epiboly using microinjection of UDP-GalNAz and detection with copper-free click chemistry. Zebrafish embryos were microinjected with 25 pmol of UDP-GalNAz (top) or UDP-GalNAc (bottom), along with the tracer dye rhodaminedextran, and allowed to develop to 50% epiboly (5.5 hpf, 1st and 5th rows), 65% epiboly (7 hpf, 2nd and 6th rows), 80% epiboly (8.5 hpf, 3rd and 7th rows), or 95% epiboly (9.5 hpf, 4th and 8th rows). Embryos were then reacted with DIFO-488 (100 μM, 1 h) and imaged by confocal microscopy. Shown are maximum intensity z-projection fluorescence images and corresponding brightfield images. Embryos are orientated with the animal pole up, but randomly with respect to the dorsal-ventral axis. Faint azide-independent signal at 50% epiboly is due to nonspecific uptake of DIFO-488 by rapidly endocytosing dorsal forerunner cells. Green, DIFO-488; red, rhodamine-dextran. Scale bar: 200 μm. |
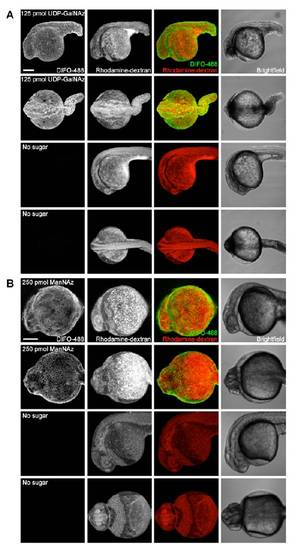
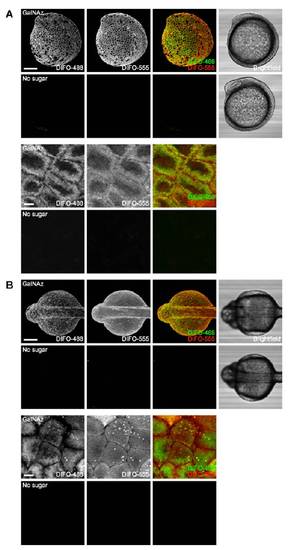
Microinjection of higher doses of azidosugars. Zebrafish embryos were microinjected with 125 pmol of UDP-GalNAz (A, top), 125 pmol of UDP-GalNAc (A, bottom), 250 pmol of ManNAz (B, top), or no sugar (B, bottom), along with the tracer dye rhodaminedextran. The embryos were allowed to develop to 24 hpf, reacted with DIFO-488 (100 μM, 1 h), and imaged by confocal microscopy. Shown are maximum intensity z-projection fluorescence images and corresponding brightfield images. Green, DIFO-488; red, rhodamine-dextran. Scale bar: 200 μm. |
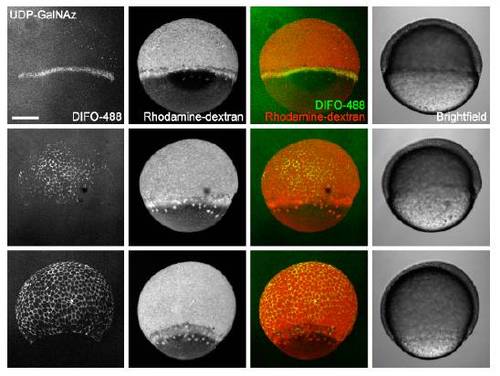
Manual dechorionation with forceps does not afford labeling before 65% epiboly. Zebrafish embryos were microinjected with 25 pmol of UDP-GalNAz and the tracer dye rhodamine-dextran, manually dechorionated using forceps at 3 hpf, and allowed to develop to 50% epiboly (5.5 hpf, 1st row), 65% epiboly (7 hpf, 2nd row), or 80% epiboly (8.5 hpf, 3rd row). Embryos were then reacted with DIFO-488 (100 μM, 1 h) and imaged by confocal microscopy. Shown are maximum intensity z-projection fluorescence images and corresponding brightfield images. Green, DIFO-488; red, rhodamine-dextran. Scale bar: 200 μm. |
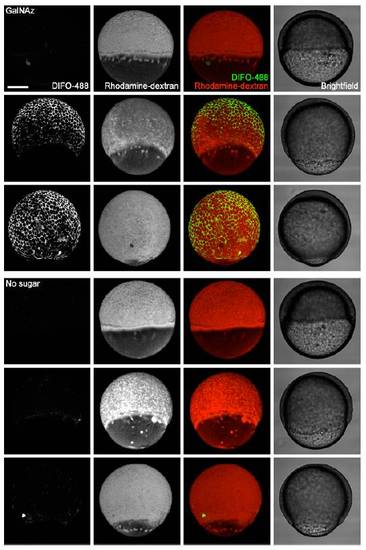
In vivo imaging of glycans during epiboly using microinjection of GalNAz and detection with copper-free click chemistry. Zebrafish embryos were microinjected with 25 pmol of GalNAz (top) or no sugar (bottom), along with the tracer dye rhodamine-dextran, and allowed to develop to 50% epiboly (5.5 hpf, 1st and 4th rows), 65% epiboly (7 hpf, 2nd and 5th rows), or 95% epiboly (9.5 hpf, 3rd and 6th rows). Embryos were then reacted with DIFO-488 (100 μM, 1 h) and imaged by confocal microscopy. Shown are maximum intensity z-projection fluorescence images and corresponding brightfield images. Green, DIFO-488; red, rhodaminedextran. Scale bar: 200 μm. |
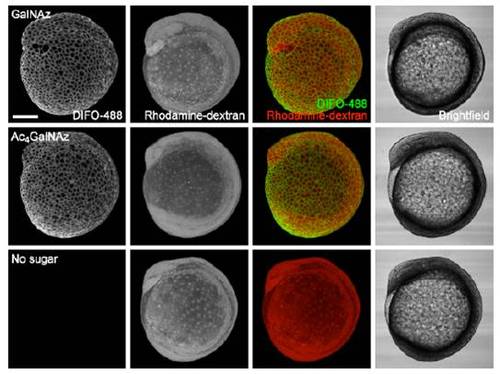
Microinjection of Ac4GalNAz and GalNAz afford comparable labeling before 24 hpf. Zebrafish embryos were microinjected with 25 pmol of GalNAz, 25 pmol of Ac4GalNAz, or no sugar, along with the tracer dye rhodamine-dextran, and allowed to develop. At 10 hpf, the embryos were reacted with DIFO-488 (100 μM, 1 h) and then imaged by confocal microscopy. Shown are maximum intensity z-projection fluorescence images and corresponding brightfield images. Green, DIFO-488; red, rhodamine-dextran. Scale bar: 200 μm. |
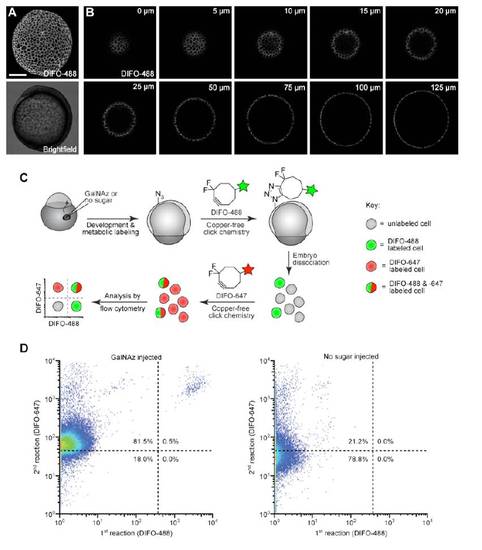
Distribution of GalNAz- and DIFO-488-labeled cells from 10 hpf embryos. Zebrafish embryos were microinjected with 25 pmol of GalNAz, allowed to develop to 10 hpf, and then reacted with DIFO-488 (100 μM, 1 h). (A) Maximum intensity z-projection fluorescence image and corresponding brightfield image. (B) Several individual z-planes from the z-projection shown in (A), demonstrating labeling of the surface cells. Distances indicated are in the z direction from the top of the embryo. (C) Schematic of dual-labeling flow experiment. Following microinjection with GalNAz and reaction with DIFO-488, embryos were dissociated, and the resulting cell suspension was labeled with DIFO-647 (100 μM, 30 min) and then analyzed by flow cytometry. (D) Representative dot plots of cells from embryos injected with GalNAz (left) or no sugar (right). In GalNAz-injected embryos, most of the cells displayed DIFO-647-derived signal, indicating that most cells of the embryo were metabolically labeled with GalNAz. Approximately 0.5% of cells were also labeled with DIFO-488, indicating that these cells were accessible to this reagent while part of the intact embryo. Scale bar: 200 μm. |
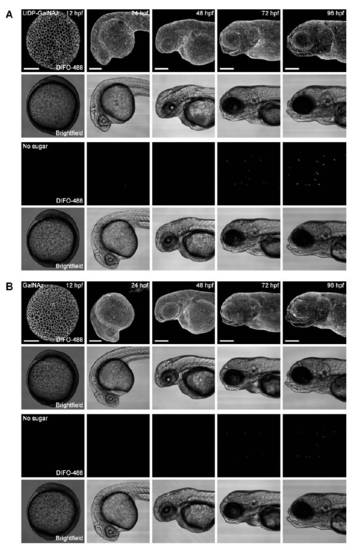
Labeling from a single bolus of GalNAz or UDP-GalNAz persists for 96 hpf. Zebrafish embryos were microinjected with 25 pmol of UDP-GalNAz (A, top), 25 pmol of GalNAz (B, top), or no sugar (A and B, bottom), and allowed to develop normally. At each timepoint shown, embryos were reacted with DIFO-488 (100 μM, 1 h) and imaged by confocal microscopy. Shown are maximum intensity z-projection fluorescence images and corresponding brightfield images. Scale bar: 200 μm. |
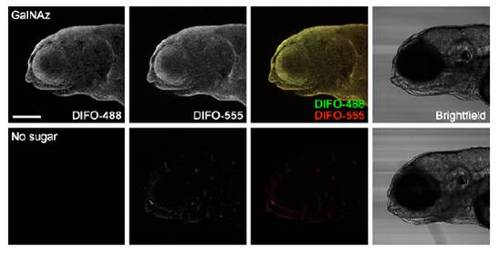
New azide-containing glycans are presented on the surface of cells out to 96 hpf. Zebrafish embryos were microinjected with 25 pmol of GalNAz (top) or no sugar (bottom) and allowed to develop to 84 hpf, at which point they were reacted with DIFO-488 (100 μM, 1 h). Unreacted azides were immediately quenched by using tris(2-carboxyethyl)phosphine (TCEP) (50 mM, 10 min), and the embryos were allowed to develop further. At 96 hpf, the embryos were reacted with DIFO-555 (100 μM, 1 h) and then imaged by confocal microscopy. Shown are maximum intensity z-projection fluorescence images of surface epithelial cells and corresponding brightfield images. Green, DIFO-488; red, DIFO-555. Scale bar: 200 μm. |
Multicolor imaging of time-resolved populations of GalNAz-labeled glycans. Zebrafish embryos were microinjected with 25 pmol of GalNAz or no sugar and allowed to develop to 9 hpf, at which point they were reacted with DIFO-488 (100 μM, 1 h). The embryos were then allowed to further develop for 2 h (A) or 12 h (B), at which point they were reacted with DIFO-555 (100 μM, 1 h) and then imaged by confocal microscopy. Shown are maximum intensity z-projection fluorescence images of surface epithelial cells and corresponding brightfield images. Green, DIFO-488; red, DIFO-555. Scale bars: 200 μm (1st, 2nd, 5th, and 6th rows), 10 μm (3rd, 4th, 7th, and 8th rows). |
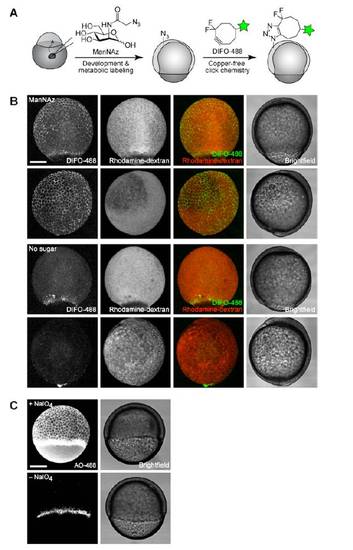
Imaging of sialylated glycans via either microinjection of ManNAz or treatment with sodium periodate. (A) Schematic depicting metabolic approach for imaging of sialylated glycans. (B) Zebrafish embryos were microinjected with 25 pmol of ManNAz or no sugar, allowed to develop to 8 hpf, reacted with DIFO-488 (100 μM, 1 h), and imaged by confocal microscopy. Shown are maximum intensity z-projection fluorescence images and corresponding brightfield images. Green, DIFO-488; red, rhodamine-dextran. (C) Zebrafish embryos (6 hpf) were bathed in NaIO4 (500 μM, 30 min, top row) or no reagent (bottom row), reacted with AO-488 (100 μM, 1 h, pH 6.7), and imaged by confocal microscopy. Shown are maximum intensity z-projection images of AO-488 fluorescence and corresponding brightfield images. Scale bars: 200 μm. |
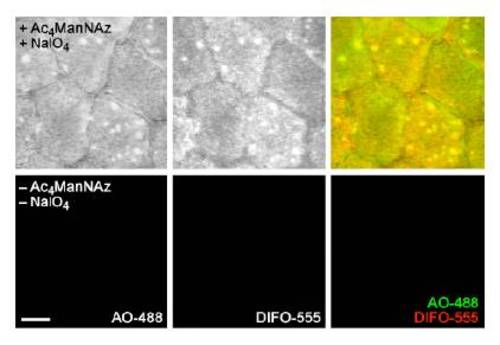
Dual labeling of sialic acids with ManNAz and NaIO4 followed by reaction with DIFO- and aminooxy-fluorophores shows substantial colocalization. Zebrafish embryos were bathed in 5 mM Ac4ManNAz or no sugar for three days, then treated with NaIO4 (500 &*mu;M, 30 min) or no reagent. Embryos were then reacted in a mixture of DIFO-555 (100 μM) and AO-488 (100 μM) in PBS (pH 6.7) for 1 h and imaged by confocal microscopy. Shown are maximum intensity z-projection fluorescence images. Green, AO-488; red, DIFO-555. Scale bar: 10 μm. |
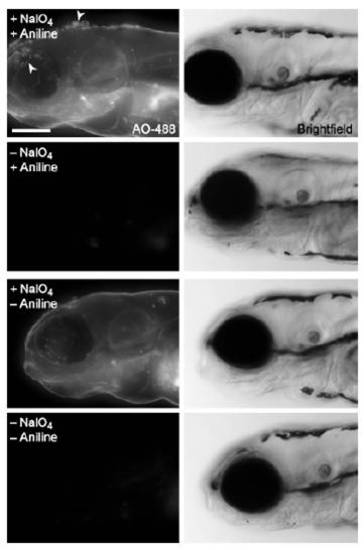
An aniline catalyst provides a modest increase in labeling of periodate-reacted glycans with aminooxy probes. Zebrafish embryos (120 hpf) were bathed in NaIO4 (1 mM, 30 min, 1st and 3rd rows) or no reagent (2nd and 4th rows), then reacted with AO-488 (100 μM, 1 h, pH 6.7) in the presence (1st and 2nd rows) or absence (3rd and 4th rows) of aniline (10 mM). Shown are maximum intensity z-projection images of AO-488 fluorescence and corresponding brightfield images. Arrowheads indicate damage to the epidermis caused by aniline. Scale bar: 200 μm. |
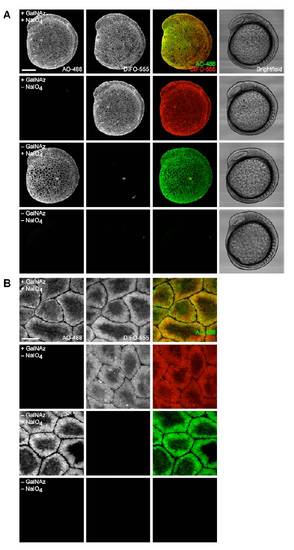
Simultaneous visualization of O-glycans and sialylated glycans during the early segmentation period. Zebrafish embryos were microinjected with GalNAz or no sugar, allowed to develop to 10 hpf, and then bathed in NaIO4 (500 μM, 30 min) or no reagent. Embryos were then reacted in a mixture of DIFO-555 (100 μM) and AO-488 (100 μM) in PBS (pH 6.7) for 1 h and imaged by confocal microscopy. Shown are maximum intensity z-projection fluorescence images and corresponding brightfield images. Green, AO-488; red, DIFO-555. Scale bars: 200 μm (A), 20 μm (B). |
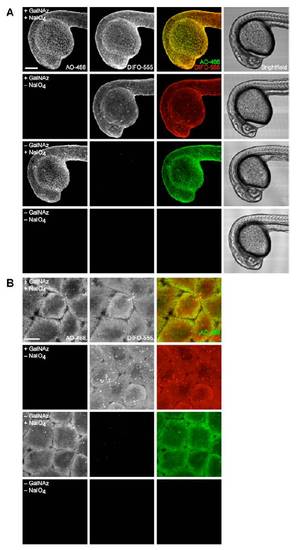
Simultaneous visualization of O-glycans and sialylated glycans at 24 hpf. Zebrafish embryos were microinjected with GalNAz or no sugar, allowed to develop to 24 hpf, and then bathed in NaIO4 (500 μM, 30 min) or no reagent. Embryos were then reacted in a mixture of DIFO-555 (100 μM) and AO-488 (100 μM) in PBS (pH 6.7) for 1 h and imaged by confocal microscopy. Shown are maximum intensity z-projection fluorescence images and corresponding brightfield images. Green, AO-488; red, DIFO-555. Scale bars: 200 μm (A), 20 μm (B). |
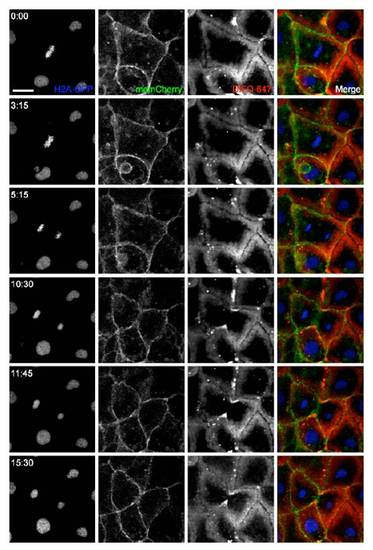
Time-lapse monitoring of membrane and glycan movement during mitosis. H2A-GFP transgenic zebrafish were microinjected into the blastomere cell at the one-cell stage with GalNAz and mRNA for memCherry. Embryos were allowed to develop to 10 hpf, at which point they were reacted with DIFO-647 (100 μM, 1 h) and imaged by confocal microscopy. Blue, H2A-GFP; green, memCherry; red, DIFO-647. A single z-plane fluorescence image is shown at each time indicated (min:s). Scale bar: 20 μm. |
Multicolor imaging of GalNAz-labeled glycans at the cleavage furrow of dividing cells. Zebrafish embryos were microinjected with GalNAz or no sugar and allowed to develop to 10 hpf, at which point they were reacted with DIFO-555 (100 μM, 1 h). Immediately following this reaction, the embryos were reacted with DIFO-488 (100 μM, 15 min) and imaged by confocal microscopy. Shown are maximum intensity z-projection fluorescence images. Green, DIFO-488; red, DIFO-555. Scale bars: 100 μm (A), 10 μm (B). |