
- Title
-
Klf6/copeb is required for hepatic outgrowth in zebrafish and for hepatocyte specification in mouse ES cells
- Authors
- Zhao, X., Monson, C., Gao, C., Gouon-Evans, V., Matsumoto, N., Sadler, K.C., and Friedman, S.L.
- Source
- Full text @ Dev. Biol.
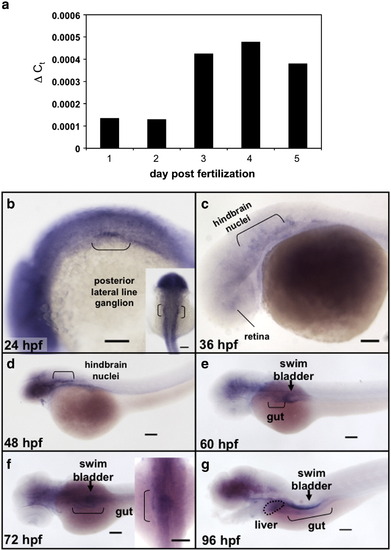
copeb expression is enriched in endoderm organs during zebrafish development. (a) Total RNA was extracted from 10 embryos taken from the same clutch on 1–5 dpf was assessed for copeb RNA expression by qPCR relative to rppO by the ΔCt method. (b-g) copeb expression pattern in developing zebrafish embryos examined by WISH at 24 hpf, 36 hpf (c), 48 hpf (d), 60 hpf (e) 72 hpf (f) and 96 hpf (g). Structures previously shown to express copeb in the early embryo are labeled in b–d. Endoderm derived structures, including the gut (brackets), liver (white arrow) and swim bladder (black arrowhead) are labeled in e–g. Other structures expressing copeb are labeled. Scale bar = 100 microns. |
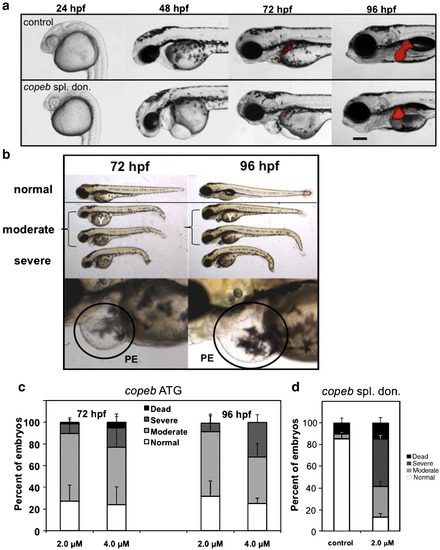
copeb is required for embryonic development. Live copeb splice donor morphants and copeb ATG morphants were examined on 1–4 dpf. (a) Live images of Tg(fabp10-RFP) embryos showed copeb slice donor morphants exhibit pericardial, yolk sac and cephalic edema at 48 and 72 hpf and a small for size liver. All images are taken at the same magnification; scale bar = 100 μm. (b) Live images of embryos showed a range of phenotypes of copeb ATG morpholino-injected embryos: normal (resembling embryos injected with the control morpholino (top), moderately affected embryos with pericardial edema, unconsumed yolk (Y) and blood congestion (middle 2 embryos) and severely affected, runted embryos (bottom). Bottom panels show the pericardial edema (PE; black circle) in morphants. These characteristics were observed in at least 10 clutches of copeb ATG morphants. (c) Quantification of the percent of embryos displaying the morphant phenotype at 72 and 96 hpf demonstrate that the phenotype becomes more severe as a function of morpholino concentration and time. Values represent the average of four clutches of at least 100 embryos were scored for each clutch on each day. Error bars indicate the standard deviation of the mean. (d) copeb splice donor morphants were quantified by phenotype and compared to uninjected controls at 96 hpf. Data are the average of at least 50 embryos per group in 3 clutches. Error bars indicate the standard deviation of the mean. |

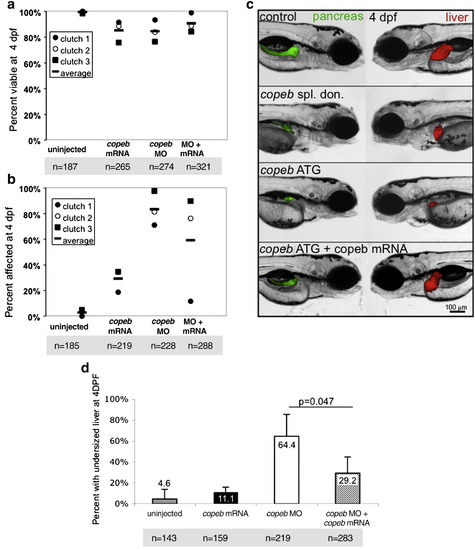
copeb is required for achieving proper liver size but is dispensable for hepatic patterning. (a–b) fabp10 WISH reveals that the small liver in 4 dpf copeb morphants extends across the midline. Two representative morphants are shown. L indicates the left side of the embryo, where the liver bud forms. (c) The number of embryos with a liver size that was less than 50% of normal was scored in 3 clutches. The total n = 75 for morphants and for controls at 3 dpf n = 71 for each at 4 dpf. p < 0.01 when comparing morphants to controls for both time points. (d) mRNA expression of genes implicated in hepatocyte function were determined by qPCR in control embryos compared to copeb morphants at 4 dpf. Expression levels were normalized to control embryos, the experiments were repeated in 3 independent clutches using 30 embryos per sample. Errors bars show standard deviation. All genes are significantly down-regulated (p < 0.05). (e–h) WISH analysis of gata6 (e, f) and prox1 (g, h) in control embryos (e, g) and copeb morphants (f, h) at 48 hpf. All control embryos had the same staining pattern. The percent of copeb morphants with staining that is indistinguishable from control embryos, as shown in the representative image, is indicated in the lower right corner of f and g (gata6: n = 41, prox1: n = 70). (i–l) Serial sections of control embryos and copeb morphants on 3 and 4 dpf were stained with H&E and the largest section through the liver (outlined) was imaged, illustrating the reduced size of the liver. Arrows point to sinusoids containing nucleated endothelial cells. Hepatocyte morphology is the same in 4 dpf control and copeb morphants (inset; scale bar = 40 μM). EXPRESSION / LABELING:
PHENOTYPE:
|

Decreased endoderm-derived organ size in copeb morphants is not due to increased cell death. (a) Cell death was examined in live copeb ATG morphants and control embryos at 24, 48, 72 and 96 hpf by acridine orange. There was increased labeling of the head and eye in copeb morphants at 24 hpf but virtually no staining in the control and morphants at any other time. White arrowheads point to the liver, which does not have any acridine positive cells in either morphants or controls. n = 60 for each sample at each time point. ot = otolith. (b) No increase in apoptosis is observed in endoderm-derived organs in 3 and 4 dpf copeb ATG morphants compared to controls. Sections of embryos on 3 and 4 dpf were stained with Cy3-streptavidin to label the liver and gut epithelium, and were processed for TUNEL using fluorescein. TUNEL positive cells (white arrow heads) are observed only in very few cells in 3 dpf sections in the brain of copeb ATG morphants. Blue = DAPI, Red = Cy3 Streptavidin, Green = TUNEL, scale bar = 50 mM. |

Decreased endoderm-derived organ size in copeb morphants is due to decreased proliferation. (a) Proliferation in whole embryos was examined at 26, 56, and 74 hpf by immunofluorescence using an antibody against phosphorylated Histone H3 (p-histone H3) to identify cells in the G2/M phase of the cell cycle. High levels of proliferation are found in the head, eyes and tails of both morphants and controls; n = 20 for each sample at each time point. (b–d) Hepatocyte proliferation was assessed by nuclear PCNA staining of serial sections of the liver (outlined) in control embryos (b) and copeb morphants (c) on 4 dpf and was quantified in (d). scale bar = 20 microns. At least 1000 hepatocytes in at least 2 control and 3 morphant embryos were scored for each sample. |
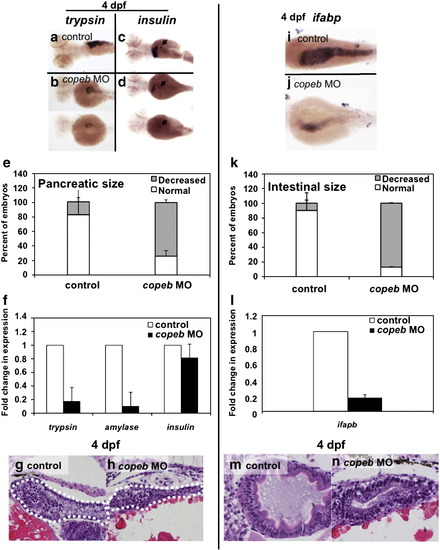
copeb is required for expansion of the exocrine pancreas and intestine. Pancreatic development was assessed by WISH for trypsin (a, b) and insulin (arrowhead in c, d) in 4 dpf uninjected controls (a, c) and copeb ATG morphants (b, d). The fabp10 probe was included with the insulin probe as a control. Two morphants are shown to indicate the range of phenotype. (e) The size of the exocrine pancreas was scored as either normal, indicating a wide pancreatic head and long tail, or reduced, indicating that the trypsin stained tissue was less than ½ what is typically observed in control fish; 73.9% of the copeb morphants had reduced pancreas size versus 17.7% in controls (n = 50, p < 0.01). (f) Expression of markers of the exocrine pancreas (trypsin and amylase) and endocrine pancreas (insulin) were analyzed by qPCR, with rppO as a reference in 4 dpf morphant and control larvae. The average fold change 3 clutches of morphants were determined by normalizing to the average expression in uninjected controls. (g, h) H&E stained sagittal sections of 4 dpf embryos through the widest part of the pancreas (outlined) illustrate a well formed exocrine pancreas in control embryos and a significantly smaller exocrine pancreas in copeb morphants. (i, j) WISH using ifabp as a marker of gut epithelial cells on 4 dpf embryos revealed slight staining of only the intestinal bulb in copeb morphants. (k) 4 dpf uninjected controls and copeb morphants processed by WISH for ifabp. Controls and morphants from 3 clutches (n = 50 for each) were scored as normal if they had staining in a thick and curved intestinal bulb as well as staining in the distal intestine, or as decreased if the staining was confined to the intestinal bulb and if the intestine was thin. Decreased gut ifabp staining was observed in 10.0% of the control versus 87.1% of the morphants (p < 0.01). (l) ifabp mRNA level in 4 dpf embryos using qPCR with rppO as a reference was averaged in 3 clutches of copeb morphants and normalized to the average expression in controls. (m, n) H&E staining of 4 dpf embryos shows well-differentiated intestinal epithelial cells copeb morphants, however the intestinal villi do not form. |

cdkl1a expression is increased in copeb morphants. (a) cdkl1a was assessed by qPCR in control or copeb morphant embryos on 1–4 dpf. Levels were averaged from 3 experiments and normalized to the averages of controls, with errors bars showing standard deviation. * indicates p < 0.001; ** p = 0.07. (b) WISH for cdkl1a in 24 hpf controls and copeb splice donor morphants shows an increase in cdkI1a expression in the hatching gland (brackets) of morphants. |

|
|

|

Unillustrated author statements EXPRESSION / LABELING:
PHENOTYPE:
|
Reprinted from Developmental Biology, 344(1), Zhao, X., Monson, C., Gao, C., Gouon-Evans, V., Matsumoto, N., Sadler, K.C., and Friedman, S.L., Klf6/copeb is required for hepatic outgrowth in zebrafish and for hepatocyte specification in mouse ES cells, 79-93, Copyright (2010) with permission from Elsevier. Full text @ Dev. Biol.