
- Title
-
Complexity of cis-regulatory organization of six3a during forebrain and eye development in zebrafish
- Authors
- Chao, C.H., Wang, H.D., and Yuh, C.H.
- Source
- Full text @ BMC Dev. Biol.
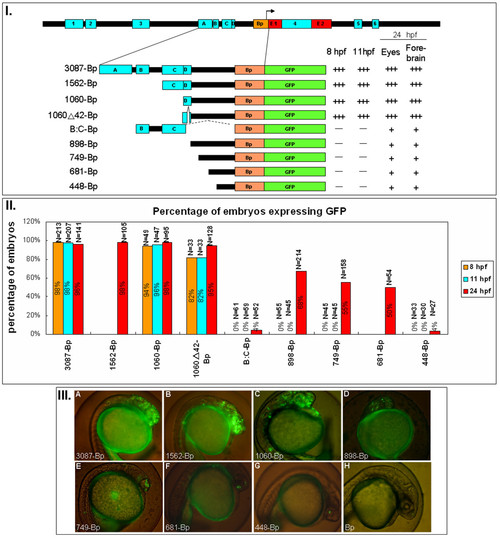
six3a promoter deletion mutant constructs. I. Different deletion constructs used to study the combinatory effect of those modules. The names of those constructs are given by the length of each DNA fragments ligated to Bp. Followed each construct are the summary of the GFP expression level after microinjection into zebrafish embryos. Zebrafish embryos injected with each construct expressing GFP at different times (8, 11 and 24 hpf) and regions (eyes, forebrain and ectopic) are labeled "+", "++" and "+++" to indicate different levels of GFP intensity. The symbol "-" indicates the absence of GFP expression. II. The percentages of embryos expressing GFP from different batches are shown in the bar graph. The total numbers of embryos are indicated as N=number above each bar. Three different time points were shown: 8 hpf (orange), 11 hpf (blue) and 24 hpf (red). III. Representative GFP expression patterns for each construct. (A) 3087-Bp-GFP shows accurate and strong GFP expression in the forebrain and eyes. (B) 1562-Bp-GFP shows a similar expression pattern to 3087-Bp, with minor ectopic expression on the ventral side. (C) 1060-Bp-GFP shows similar expression and strong ectopic expression on the ventral side. (D) 898-Bp-GFP shows weak expression in the eyes and forebrain. (E) 749-Bp-GFP shows GFP expression in the eyes. (F) 681-Bp-GFP has GFP expression extending to the eye. (G) 448-Bp has very weak GFP expression in the eyes. (H) Bp-GFP, as a control, shows almost no expression of GFP, except for 1-2 cells in the forebrain region. |
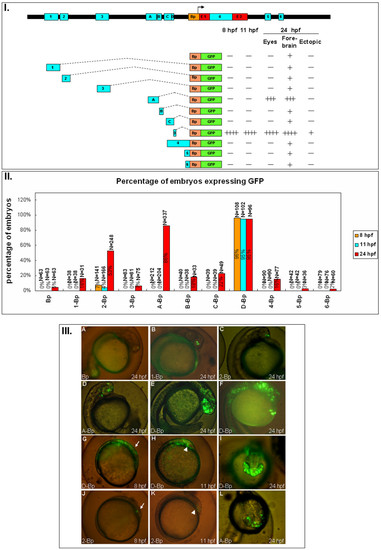
The expression pattern of the ten conserved non-coding modules of zebrafish six3a. I. Different constructs used to study the function of each module. Followed by each construct are the summary of the GFP expression level. Zebrafish embryos injected with each construct expressing GFP at different times (8, 11 and 24 hpf) and regions (eyes, forebrain and ectopic), as in figure 2, the plus and minus indicated the level of GFP intensity. II. The percentages of embryos expressing GFP from different batches are shown with the total numbers of embryos, and three time points: 8 hpf (orange), 11 hpf (blue) and 24 hpf (red). III. Representative GFP expression patterns for each construct in lateral views (A-F, G-H, J-K) or dorsal view (I, L). Most of the images are from 24 hpf except for G and J at 8 hpf, and H and K at 11 hpf (A) Bp-GFP. (B) 1-Bp-GFP. (C) 2-Bp-GFP. (D) A-Bp-GFP. (E) D-Bp-GFP expresses GFP in forebrain and midbrain. (F) D-Bp-GFP expresses GFP extending to the notochord. (G) D-Bp-GFP expression pattern at 8 hpf; the anterior position is marked with an arrow. (H) D-Bp-GFP expression pattern at 11 hpf; the position of the brain is marked with an arrowhead. (I) D-Bp-GFP at 24 hpf showing ventral expression in addition to the forebrain and eye. (J) 2-Bp-GFP expresses at 8 hpf; the anterior position is marked with an arrow. (K) 2-Bp-GFP expression pattern at 11 hpf; the position of the brain is marked with an arrowhead. (L) A-Bp-GFP. |

Constructs and representative images for module A. I. Different constructs used to study the function of six3a module A. The names of those constructs were given by the length of the DNA fragment left after 5′ or 3′ deletion. The number after A indicates the length of module A left after 5′ deletion. The small triangle indicates the length of module A left after 3′ deletion. Followed by each construct are the summary of the GFP expression level at 24 hpf for different regions (eyes or forebrain) as plus sign (+) to indicate different levels of GFP. The minus symbol (-) indicates the absence of GFP expression, and plus/minus (+/-) indicates slightly higher GFP expression than no expression. II. The percentages of embryos expressing GFP from different batches are shown with the total numbers of embryos from 24 hpf (red). III. Representative GFP expression patterns for each construct in lateral views at 24 hpf. (A) A462-GFP. (B) A433-Bp-GFP. (C) A415-Bp-GFP. (D) A392-Bp-GFP. (E) A462(triangle)298-Bp-GFP (F) A433(triangle)298-Bp-GFP. (G) A462(triangle)298-Bp-M-GFP. (H) A392(triangle)298-Bp-GFP. The last panel shows the sequence in module A. Conserved sequences in module A were aligned among zebrafish, X. tropicalis, opossum, Tetraodon, human and mouse. The primers used to obtain serial deletion constructs are shown in red or green arrow with direction indicated forward or reverse. The 22-bp region (underlines with double red arrow) was deleted in A462(triangle)298-BP-M-GFP. The red boxes represent the highly conserved elements. |

Constructs and representative images for module D. I. Different constructs used to study the function of six3a module D. The names of those constructs were given by the length of the DNA fragment left after 5′ or 3′ deletion. The number after D indicates the length of module D left after 5′ deletion. The small triangle indicates the length of module D left after 3′ deletion. Followed by each construct are the summary of the GFP expression level at different times (8, 11 and 24 hpf) and regions (eyes, forebrain and ectopic) as plus sign (+) to indicate different levels of GFP. The minus sign (-) indicates the absence of GFP expression. II. The percentages of embryos expressing GFP from different batches are shown with the total numbers of embryos, and three time points: 8 hpf (orange), 11 hpf (blue) and 24 hpf (red). III. Representative GFP expression patterns for each construct in lateral views at 24 hpf (A-K) or 8 hpf (L-O) with the anterior position marked with an arrow. (A) D184-GFP. (B) D141-Bp-GFP. (C) D105-Bp-GFP. (D) D69-Bp-GFP. (E) D30-Bp-GFP. (F) Dorsal view of D28(2)-Bp-GFP. (G) D184(triangle)74-Bp-GFP. (H) D184(triangle)30-Bp-GFP. (I) D184(triangle)42-Bp. (J) D105(triangle)42-Bp-GFP. (K) D105(triangle)30-Bp-GFP. (L) D105, (M) D184, (N) D184(triangle)42 and (O) D69(triangle)30. The last panel shows the sequence in module D. Conserved sequences in module D were aligned among zebrafish, Tetraodon, fugu and medaka, and the primers for making the deletion constructs are shown above the sequences. See legend in Fig 4 for others symbols. |

Module A suppresses ectopic expression of module D. Images of 24 hpf embryos showing the forebrain and eye expression pattern from 3086-Bp (A, B) and ectopic expression from 1060-Bp to the notochord (C) or the whole trunk (D). (E) Statistical analysis for 144 embryos injected with 3087-Bp and 102 embryos injected with 1060-Bp. Sixty-five percent of embryos carried 1060-Bp expressed ectopically to the trunk, while only 26% of embryos carried 3087-Bp expressed ectopically, with few cells per embryos. |

EMSA analysis of modules D and A. I. EMSA of module D using nine different probes. D184 and two of the smaller probes: D184(triangle)74 covers the 5′ half, and D69 covers the 3′ half were used for EMS. Five different double-stranded oligonucleotides were generated and labeled as probes for EMSA. The 28-bp region (blue box) was generated as double strand oligonucleotide for EMSA. The gel image was obtained with probe only (lane 1, 3, 5, 7, 9, 11, 13, 15 and 17), and with nuclear extract (lane 2, 4, 6, 8, 10, 12, 14, 16 and 18) to detect the binding protein; the sequence is shown below. Conserved sequences in module D were aligned among zebrafish, Tetraodon, fugu and medaka, with the primers used to obtain serial deletion constructs shown in red with direction. The red boxes represent the highly conserved elements. II. EMSA of module A. The gel image was obtained with probe only (lane1), with nuclear extract (lane 2, 3) and with competitor (lane 4, 5) to detect the binding protein using A462(triangle)298; the sequence is shown below. The primers used to obtain serial deletion constructs are shown in green above the sequences, and their length and direction are reflected in the length and direction of the arrows. The 22-bp region (red arrow) was deleted in the A462(triangle)298-Bp-M-GFP construct. The red boxes represent the highly conserved elements. |

Competition experiment for module D probes 4 and 5. I. EMSA competition experiment of module D-probe 4. The gel image was obtained with probe only (lane 1) and with 5 and 15 μg nuclear extract (lane 2, 3) to detect the binding protein. The sequences (wild-type or Pax6.1 binding site mutant) for competition are shown below. Three different amounts (10x, 20x and 50x) of competitor were added to the binding reaction with 15 μg nuclear extract. Lanes 4, 5 and 6 are competition experiments with wild-type competitors at 10x, 20x and 50x, respectively, and lanes 7, 8 and 9 are competition experiments with the Pax6.1 site mutant at 10x, 20x and 50x, respectively. II. EMSA competition experiment of module D-probe 5. The gel image was obtained with probe only (lane 1) and with 5 and 15 μg nuclear extract (lane 2 and 3) to detect the binding protein. The sequences (wild-type or FOX binding site mutant) for competition are shown below. Three different amounts (10x, 20x and 50x) of competitor were added to the binding reaction with 15 μg nuclear extract. Lanes 4, 5 and 6 are competition experiments with wild-type competitors at 10x, 20x and 50x, respectively, and lanes 7, 8 and 9 are competition experiments with the FOX site mutant at 10x, 20x and 50x, respectively. |

Additional images for 3087-Bp and 1060-Bp. More GFP images for 3087-Bp and 1060-Bp are shown in this file. |