
- Title
-
The lta4h Locus Modulates Susceptibility to Mycobacterial Infection in Zebrafish and Humans
- Authors
- Tobin, D.M., Vary, J.C. Jr, Ray, J.P., Walsh, G.S., Dunstan, S.J., Bang, N.D., Hagge, D.A., Khadge, S., King, M.C., Hawn, T.R., Moens, C.B., and Ramakrishnan, L.
- Source
- Full text @ Cell

A Forward Genetic Screen Identifies Zebrafish Mutants with Altered Susceptibility to Mm Infection (A) Diagram of zebrafish larva anatomy showing injection sites used in this study. (B) Schematic diagram of forward genetic screen showing derivation of F2 gynogenetic diploid embryos infected at two dpf. Potential mutants were confirmed by backcrossing the corresponding F1 female and recovering the observed mutation in the F3 generation. (C–H) Fluorescence images of WT and mutant sibling fish at 5 dpi with equivalent bacterial inocula. Arrows, granulomas; white arrowheads, individual infected macrophages; yellow arrowheads, pairs of highly infected macrophages out of the focus plane that have not formed granulomas. Scale bars, 500 μm. (C) WT and (D) aggregation mutant fh212 sibling. (E) WT and (F) resistant mutant fh199 sibling. (G) WT and (H) hypersusceptible mutant fh112 sibling. (I and J) Fluorescence and Differential Interference Contrast (DIC) overlay of 6 dpi WT fish with granuloma (arrow) (I) and aggregation mutant fh141 sibling (J) with highly infected macrophages (arrowheads) that have not aggregated. The scale bar represents 50 μm. |
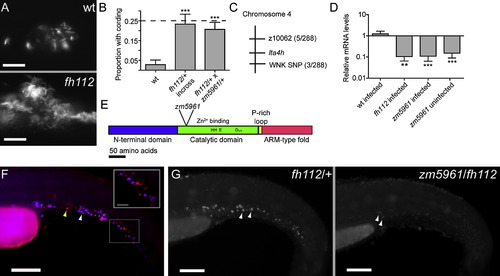
Mutations in the leukotriene A4 hydrolase Gene Result in Decreased lta4h mRNA Expression and Increased Susceptibility to Mycobacterial Infection (A) Fluorescence images of infection foci at 5 dpi with initial dose of 115 bacteria showing well-formed granuloma in WT fish (top) and profuse bacterial clusters showing cording morphology in hypersusceptible mutant fh112 sibling (bottom). The scale bar represents 25 μm. (B) Proportion of fish with cording morphology at 5 dpi with 150–250 bacteria in five independent clutches of 50–100 animals each of fh112/+ heterozygote or WT crosses and three independent clutches of 20–25 animals each from fh112/+ x zm5961/+ heterozygote crosses. Dotted line represents the theoretical maximum for a completely penetrant recessive mutation. Error bars represent the standard deviation (SD). ***p < 0.001 (one-way ANOVA with Tukey′s post-test). (C) Genetic map of fh112 placing it between the polymorphic markers z10062 and a SNP in a PRKWNK1-related gene on zebrafish chromosome 4. Parentheses indicate the number of recombination events as a ratio of the total number of informative meioses scored. (D) Mean lta4h RNA levels measured by qRT-PCR from 3–5 biological replicates of 30 fish. Infected fh112 mRNA assessed at 4 dpi, infected and uninfected zm5961 RNA at three dpf (1 dpi for infected zm5961 fish). Fold difference expressed relative to matched WT uninfected controls. **p < 0.01; ***p < 0.001 (ANOVA with Tukey′s post-test). Error bars represent the SD. (E) Gene structure of zebrafish lta4h with location of the zm5961 insertion and key conserved residues in the catalytic domain indicated (Haeggstrom, 2004). (F) Fluorescent in situ hybridization (FISH) of lta4h (red) combined with mpo antibody staining for neutrophils (blue) in caudal hematopoietic tissue of two dpf uninfected fish. Yellow arrowhead, lta4h-staining, mpo-negative presumed macrophage. White arrowhead, dual staining neutrophil. Scale bar, 100 μm. Inset scale bar represents 25 μm. (G) lta4h FISH in uninfected fh112/+ heterozygote (left) and zm5961/fh112 non-complementing sibling (right) at two dpf. Arrowheads point to brightly staining cells in fh112/+ heterozygote and to weakly-expressing cells in non-complementer. The scale bar represents 100 μm. See also Figure S1. EXPRESSION / LABELING:
|
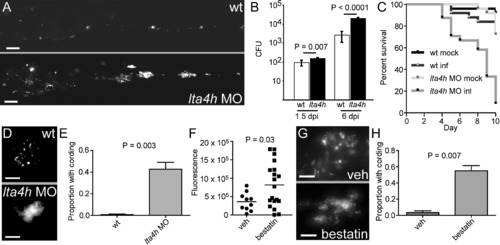
lta4h MO Knockdown Results in Increased Susceptibility to Mm (A) Representative fluorescence images of control (top) and lta4h morphant (bottom) fish 5 dpi with 173 bacteria. The scale bar represents 200 μm. (B) Mean bacterial loads per embryo for control (wt) and lta4h morphant embryos at 1.5 and 6 dpi with 150 bacteria (n = 4 groups of 5 animals for each time point). Error bars represent the SD. (C) Survival of control and lta4h morphant fish mock-injected or injected with 177 bacteria (n = 25 per group). Hazard Ratio for death of infected morphants = 9.0, p < 0.0001 (Kaplan Meier method with log-rank [Mantel-Cox] test). Data representative of three independent experiments. (D) Fluorescence image of non-cording bacteria within a granuloma in control animals (top) and cording bacteria in lta4h morphant (bottom) at 5 dpi with infection dose of 150 bacteria. The scale bar represents 20 μm. (E) Mean proportion of animals with cording in three independent groups of 15–40 animals 4 dpi with 173 bacteria. p = 0.003 (Student′s unpaired t test). Error bars represent the standard error of the mean (SEM). (F) Bacterial burden at 5 dpi as determined by fluorescence pixel counts (FPC) for vehicle-treated or 100 μM bestatin-treated animals after injection with ∼150 CFU Mm. p = 0.03 (Student′s unpaired t test). (G) Fluorescence image of non-cording bacteria within a granuloma in control animals (top) and cording bacteria in animals treated with 100 μM bestatin (bottom) at 5 dpi as described in (F). The scale bar represents 10 μm. (H) Quantitation of cording at 4 dpi in five independent groups of 10–30 animals treated with vehicle or 100 μM bestatin after injection with 100–200 CFU Mm. p = 0.007 (Student′s unpaired t test). Error bars represent the SEM. |
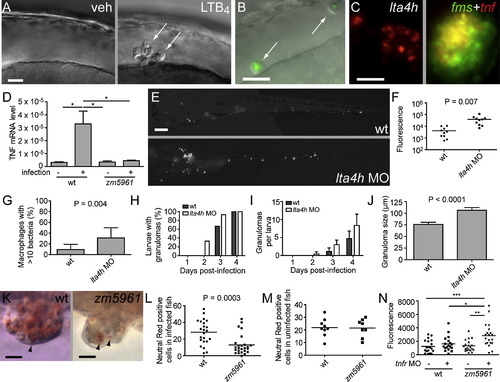
lta4h Deficiency Compromises TNF Induction and Phenotypically Resembles TNF Signaling Deficiency (A) DIC image of HBV of 30 hpf-embryo 6 hr post-injection with vehicle (left) or 1.5 x 10⁻¹⁴ mol LTB4 (right). Arrows, macrophages. (B) Fluorescence and DIC overlay image of HBV of 30 hpf mutant fh112 embryo (obtained from incross of fh112/+ heterozygotes) 6 hr post-injection with GFP-expressing Mm. Arrows, infected macrophages. After scoring for macrophage recruitment, genotype of embryos was identified based on cording phenotype at 4 dpi. The scale bar represents 20 μm. (C) lta4h FISH showing staining of an early-stage granuloma 2 dpi (left); dual FISH showing tnf expression in macrophages of 4 dpi granuloma macrophages by demonstrating colocalization of the macrophage marker fms (green) and tnf (red). The scale bar represents 20 μm. (D) Relative TNF mRNA levels (relative to a β-actin standard) assessed by qRT-PCR at 1 dpi following infection of 30 WT or zm5961 larvae with 93 WT bacteria. Error bars represent the SEM. Representative of two independent experiments. (E) Representative fluorescence images of control (top) or lta4h morphant (bottom) animals 3 dpi with 130 erp mutant bacteria. (n = 10 for each condition.) The scale bar represents 20 μm. (F) Quantification of bacterial burdens by fluorescence pixel counts (FPC) of all animals from (D) at 6 dpi. (G) Proportion of single macrophages containing > 10 bacteria in 15 control and 12 lta4h morphant animals at 3 dpi with 130 erp mutant bacteria. Error bars represent the SD. (H–J) Serial assessment of granuloma formation in control (dark bars) and lta4h morphants (light bars) injected with 230 bacteria (n = 15 each) by fluorescence and DIC microscopy for 4 dpi. (H) Percentage of animals with at least one granuloma over time. lta4h morphants form granulomas earlier; they are significantly more likely to have at least one granuloma than WT at 2 dpi (p = 0.042; Fisher′s exact test). (I) Average number of granulomas per fish over time. p < 0.001 when comparing both time post-infection and morphant status by two-way ANOVA. Error bars represent the SD. (J) Morphometric analysis of control MO (WT) and lta4h MO granuloma size at 4 dpi; error bars represent the SEM. (K) Neutral red labeling of granuloma macrophages in WT and zm5961 granulomas. Arrowheads indicate examples of neutral red positive macrophages. Fish were infected with approximately 250 bacteria then neutral red stained at 4 dpi, six dpf. The scale bar represents 10 μm. (L) Numbers of neutral red stained cells in the tails of infected WT and zm5961 fish infected as described in (K). p = 0.0003 (Student′s unpaired t test). (M) Quantitation of neutral red stained cells in the tails of uninfected WT and zm5961 fish at 6 dpf. (N) Bacterial burdens (FPC) at 4 dpi with 75 bacteria in control or TR1 morphants in the background of either WT or zm5961 animals. *p < 0.05; **p < 0.01; ***p < 0.001. (one-way ANOVA with Tukey′s post-test; all other comparisons not significant). See also Figure S2, Figure S3, and Movie S1. |

lta4h Deficiency Induces an Immunoregulatory Phenotype Recapitulated by Exogenous LXA4 (A and B) tnf mRNA expression in control and lta4h morphant fish infected with Mm, injected with LTB4, or both. Each bar represents a mean of three independent pools of 20–30 animals. Error bars represent the SD. (A) tnf mRNA levels in control and morphant fish injected with 110 bacteria and at 1 dpi mock-injected or injected with 1.5 x 10⁻¹⁴ mol LTB4 into the caudal vein 2.5 hr prior to RNA extraction. *p < 0.05; **p < 0.01 (one-way ANOVA. All other comparisons not significant). (B) tnf mRNA levels in uninfected three dpf control or lta4h morphant animals 2.5 hr after injection of 1.5 x 10⁻¹⁴ mol LTB4 into the caudal vein. (C) Diagram of LTB4 and LXA4 biosynthetic pathways. Reduction of LTA4H activity (red) is hypothesized to result in increased synthesis of LXA4 through pathway marked by green arrow. (D) iNOS antibody staining in infected WT and zm5961 animals. Green represents GFP-expressing Mm and red represents iNOS staining. Animals were infected with approximately 100-150 bacteria and fixed for antibody staining and imaging at 3 dpi. The scale bar represents 25 μm. (E) Numbers of iNOS positive cells in WT and zm5961 animals as described in (D) for both total number of iNOS positive cells in the tail (p = 0.008) and iNOS positive cells within granulomas (p = 0.01). (F) Light microscopy images of Sudan black stained-neutrophils in right ear of three dpf animals injected with vehicle (left and middle) or 3.5 x 10⁻¹⁴ mol of LXA4 (right) 10 hr prior and with vehicle (left) or 1.5 x 10⁻¹⁴ mol LTB4 (middle and right) into the right ear 4 hr prior. The scale bar represents 50 μm. (G) Mean number of neutrophils in ears of animals in (F). *p < 0.05; ***p < 0.001 (Kruskal-Wallis nonparametric one-way ANOVA with Dunn′s post-test; other comparisons not significant). (H) Mean number of neutrophils in ears of three dpf controls, lta4h morphant and zm5961 mutant animals either infected (135 CFU) or mock-infected 1 day prior then injected into right ear with 1.5 x 10⁻¹⁴ mol LTB4 and scored 4 hr later. *p < 0.05; **p < 0.01; ***p < 0.001 (One-way ANOVA with Tukey′s post-test; all other pairwise comparisons not significant). (I) Mean number of neutrophils recruited to ears of three dpf uninfected animals injected into right ear with 1.5 x 10⁻¹⁴ mol LTB4 after overnight exposure to vehicle or 1 μM PD146176. **p < 0.01; ***p < 0.001 (One-way ANOVA with Tukey′s post-test). (J) Mean tnf levels relative to uninfected controls in animals (25–30 per group) 8 hr after single dose of 3.5 x 10⁻¹⁴ mol LXA4 or vehicle injected into caudal vein 3 dpi with either mock-infection or with 158 bacteria. Error bars, SD. Representative of three independent experiments. (K) Mean bacterial burdens (FPC) in 5 dpi WT fish infected at two dpf with 212 CFU and, beginning 1 dpi, given injections of 3.5 x 10⁻¹⁴ mol of LXA4 or vehicle every 12 hr into the caudal vein for 4 days (n = 18 per group). p = 0.0283 (Unpaired t test with Welch′s correction to account for unequal variances). (L) Examples from (K) of non-cording bacteria within granuloma in vehicle-injected fish and cording bacteria in LXA4-injected fish at 5 dpi. The scale bar represents 30 μm. (M) Quantitation of cording from (K and L) at 5 dpi. p = 0.018 by Fisher′s exact test of a contingency table. See also Figure S4. |

Mutations in the lta4h Locus Result in an Extracellular Cording Phenotype, Related to Figure 2 (A) Critical interval on zebrafish Chromosome 4 for fh112, bounded by closest polymorphic genetic markers. Predicted ORFs in the interval are indicated with arrows. Numbering and gene predictions based on Ensembl Zv6 assembly (www.ensembl.org). (B) Gene structure of zebrafish lta4h locus with percent identity to human lta4h color-coded. Location of the retroviral insertion in the zm5961mutant and position of its in-frame 88 amino acid deletion is indicated. (C) Fluorescence image of non-cording bacteria within a granuloma in matched sibling control animals (left) and cording bacteria in zm5961 (right) at 5 dpi with infection dose of 161 ± 33 (SD) bacteria. Scale bars, 20 μm. (D) Mean proportion of animals with cording in three independent groups of 15-25 animals five dpi with 161 ± 33 (SD) bacteria. p = 0.01 (Student′s unpaired t test). Error bars, SEM. |
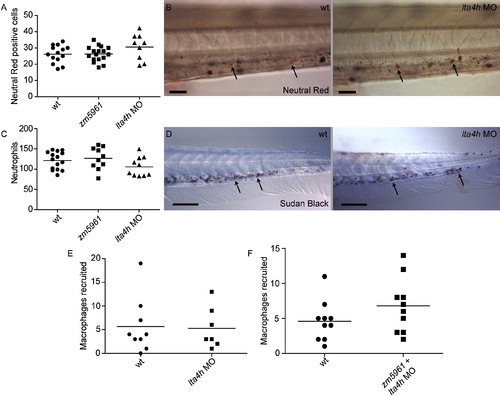
lta4h Deficiencies Do Not Affect Macrophage or Neutrophil Number or Recruitment, Related to Figure 4 (A and B) Live uninfected animals were stained with neutral red at three dpf to quantitate the number of macrophages in control, zm5961 mutant, and lta4h morphant animals. (A) The number of neutral red positive cells posterior to the yolk tube was determined. No significant differences in macrophage number were observed (one-way ANOVA). (B) Example of neutral red positive cells (arrows) stained at three dpf in wild-type and lta4h morphant animals. Scale bar, 25 μm. (C and D) Uninfected fixed animals were stained with Sudan Black at three dpf to quantitate the number of neutrophils present. (C) Quantitation of the number of neutrophils posterior to the yolk tube. No significant differences among control, zm5961, and lta4h morphant were found (one-way ANOVA). (D) Example of Sudan Black neutrophil staining in the tail of wild-type and morphant animals. Scale bar, 100 μm. (E) LTA4H and control morphant animals were injected in the hindbrain ventricle with 150-200 bacteria at 24 hpf. The number of recruited macrophages was assessed 6 hr later by DIC microscopy. No significant differences between control and morphant were found using Student′s unpaired t test. (F) WT animals compared to zm5961 mutants that had also been injected with the lta4h morpholino. Animals were infected in the hindbrain ventricle and assayed for macrophage recruitment as described above. PHENOTYPE:
|

Mutation of lta4h Does Not Affect Annexin V Staining During Infection, Related to Figure 4 (A) Wild-type (left) and zm5961 (right) granulomas after Annexin V staining (green). Bacteria are red. Staining was performed 4 dpi after infection with 250–300 CFU M. marinum. Scale bars, 5 μm. (B) Quantitation of Annexin V positive cells per granuloma in wild-type and zm5961 animals (n = 7 animals for each class, total number of granulomas analyzed: 21 for wild-type, 25 for zm5961). No significant difference by Student′s unpaired t test. |
Reprinted from Cell, 140(5), Tobin, D.M., Vary, J.C. Jr, Ray, J.P., Walsh, G.S., Dunstan, S.J., Bang, N.D., Hagge, D.A., Khadge, S., King, M.C., Hawn, T.R., Moens, C.B., and Ramakrishnan, L., The lta4h Locus Modulates Susceptibility to Mycobacterial Infection in Zebrafish and Humans, 717-730, Copyright (2010) with permission from Elsevier. Full text @ Cell