
- Title
-
Epithelial relaxation mediated by the myosin phosphatase regulator Mypt1 is required for brain ventricle lumen expansion and hindbrain morphogenesis
- Authors
- Gutzman, J.H., and Sive, H.
- Source
- Full text @ Development
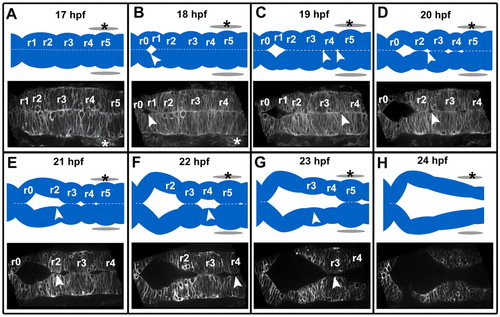
The sequence of zebrafish wild-type hindbrain ventricle opening. Time course of wild-type hindbrain ventricle opening from 17 to 24 hpf. Embryos were injected with memGFP mRNA (n=12). Images (and corresponding diagrams) are a representative snapshot of the hindbrain opening at each time point. (A) At 17 hpf the neural tube is closed with visible rhombomere (r) morphology. (B) At 18 hpf the initial opening is visible at the r0/r1 boundary. (C) At 19 hpf openings surrounding r4 are visible. (D) At 20 hpf there are openings at the r2/r3 boundary and r1 has separated completely. (E) At 21 hpf opening within r2 occurs. (F) At 22 hpf separation within r4 has occurred. (G) At 23 hpf separation within r3 has occurred. (H) At 24 hpf separation within r5 occurs resulting in an open ventricle and less prominent rhombomere morphology. Asterisks indicate the ear. Arrowheads indicate regions that are separating. Anterior is to the left. |
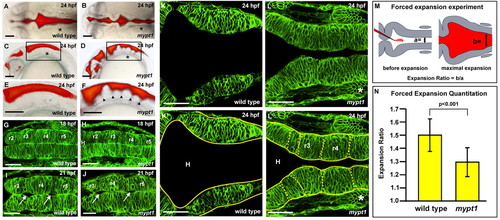
The mypt1 mutant phenotype. (A-F) Wild-type (A,C,E) and mypt1 mutant (B,D,F) zebrafish brain ventricle injections at 24 hpf. Views are dorsal (A,B) or lateral (C,D). (E,F) Higher magnification of boxed regions from C and D, respectively. Arrowheads indicate rhombomere boundaries. (G-L′) Live confocal imaging of the hindbrain in wild type (G,I,K,K′) and mypt1 mutants (H,J,L,L′) after memGFP mRNA injection. (G,H) Wild type (G) and mypt1 mutants (H) at 18 hpf. (I,J) Wild type (I) and mypt1 mutants (J) at 21 hpf showing similar morphology and hindbrain openings (arrows). (K-L′) Wild type (K) and mypt1 mutants (L) at 24 hpf. (K′,L′) The same images as in K and L but with neuroepithelial tissue outlined in yellow. Dashed lines denote rhombomere morphology (L′). n>10 for all panels. mypt1 mutants have a normal neural tube, suggesting maternal gene expression is sufficient for brain development until the end of neurulation. Consistent with this, inhibition of Mypt1 expression using a start site MO led to a disorganized neural tube (data not shown), whereas a splice site MO (see Fig. S1 in the supplementary material) showed a phenotype only after the neural tube had formed. (M) Schematic of the hindbrain before and at maximum forced ventricle expansion by high-pressure injection of fluid; a and b indicate the regions that were measured. (N) Quantitation of the expandability of the hindbrain neuroepithelium in wild type and mypt1 mutants. Two independent experiments were averaged; wild type, n=12; mypt1, n=15. Data are represented as an expansion ratio ± s.d. Results are significantly different (P<0.001, Mann-Whitney U-test). Asterisks denote the ear. Anterior is to the left. H, hindbrain ventricle. Scale bars: 100 μm in A-F; 50 μm in G-L′. |
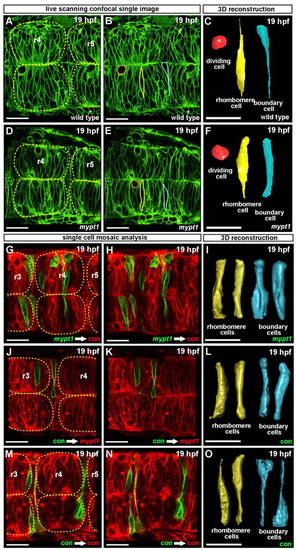
Abnormal cell shape in mypt1 mutants and cell shape mosaic analysis. (A-F) Wild-type and mypt1 mutant zebrafish embryos injected with memGFP mRNA and confocally imaged. Single cells were traced through a z-series then reconstructed in 3D. (A) Wild-type embryo at 19 hpf. (B) Same image as in A but with the three cells outlined shown in one z-plane. (C) 3D shape of the cells shown in B. (D) mypt1 mutant embryo at 19 hpf. (E) Same image as in D but with the three cells outlined shown in one z-plane. (F) 3D shapes of cells shown in E. Rhombomeres are outlined with yellow dashed lines and boundary cells are visible between rhombomeres (A,D). Red, dividing cell; yellow, rhombomere cell; blue, boundary cell. Wild-type and mypt1 mutant dividing cells were similar in shape. Each image is representative of three independent experiments; at least three embryos were imaged and three to five cells were reconstructed in 3D for each embryo, per experiment. (G-O) Wild-type embryos were injected with control MO or mypt1 MO and memCherry or memGFP mRNA as indicated. Cells were transplanted from the memGFP-injected donors to memCherry-injected hosts. Transplanted embryos were imaged at 19 hpf by laser-scanning confocal microscopy. (G,H) Control MO-injected host (red) with mypt1 MO donor cells (green). (I) 3D shape of transplanted donor cells. (J,K) mypt1 MO-injected hosts (red) with control MO donor cells (green). (L) 3D shape of transplanted donor cells. (M,N) Control MO-injected host (red) with control MO donor cells (green). (O) 3D shape of transplanted donor cells. Rhombomeres are outlined in yellow (G,J,M). Each image is representative of at least three independent experiments in which at least three embryos were imaged; three or more cells were reconstructed in 3D for each embryo per experiment. Scale bars: 25 μm. |
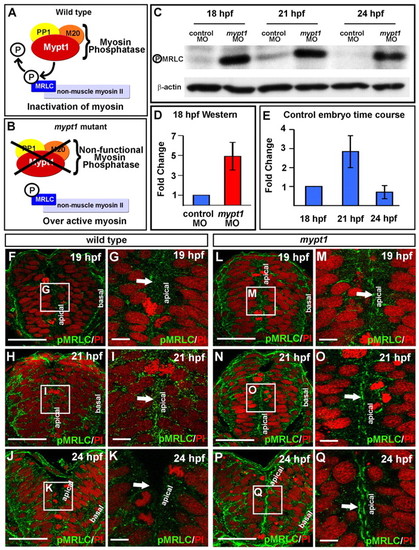
pMRLC is abnormally elevated and persists apically in the developing brain of mypt1 mutants. (A) Mypt1 as part of myosin phosphatase. (B) Hypothesis for effect of mypt1 mutant myosin phosphatase. (C) Western blot for pMRLC brain tissue dissected from zebrafish embryos at 18, 21 and 24 hpf after injection with control MO or mypt1 MO, with actin control. Approximately 100 brains were dissected for each treatment group and 50 μg of protein was analyzed. (D) Quantitation of fold changes of pMRLC normalized to actin at 18 hpf, comparing control MO-injected with mypt1 MO-injected embryos. Results are representative of three independent experiments. (E) Quantitation of fold changes of pMRLC normalized to actin over time in control MO embryos. Results are representative of three independent experiments. (F-Q) Transverse vibratome sections through the hindbrain of embryos stained for pMRLC (green) and counterstained for nuclei (propidium iodide, red). Representative images from four independent experiments; two to three embryos were imaged at each stage per experiment. Wild-type embryo at 19 (F,G), 21 (H,I) and 24 (J,K) hpf. mypt1 mutant embryo at 19 (L,M), 21 (N,O) and 24 (P,Q) hpf. (G,I,K,M,O,Q) Higher magnification of the boxed region in F,H,J,L,N,P. Dorsal is up. Arrows point to the apical neuroepithelial surface in all images. Scale bars: 50 μm in F,H,J,L,N,P; 10 μm in G,I,K,M,O,Q. |
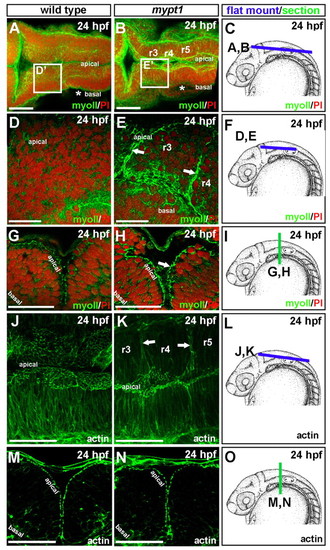
Abnormal localization of non-muscle myosin II and actin in mypt1 mutants. (A-I) Wild-type and mypt1 mutant zebrafish embryos were stained with non-muscle myosin II antibody (green) and counterstained with propidium iodide to label nuclei (red). Representative images from four independent experiments. For each experiment, two to three embryos were imaged. (A,B) 3D projection of a whole-mount wild-type (A) or mypt1 mutant (B) embryo at 24 hpf. (C) Diagram of region imaged in A and B. (D,E) Wild type (D) and mypt1 mutant (E) at 24 hpf mounted after removal of the roof plate, imaging the boxed region labeled D′ in A or E′ in B. (F) Diagram of region imaged in D and E. (G,H) Vibratome section of a 24 hpf wild-type (G) or mypt1 mutant (H) embryo. (I) Region of the embryo sectioned for G and H. (J-O) Wild type and mypt1 mutants stained with phalloidin (green). Representative images from two independent experiments. For each experiment, three to four embryos were imaged. (J,K) 3D projection of a whole-mount wild-type (J) or mytp1 mutant (K) embryo at 24 hpf. (L) Diagram of region imaged in J and K. (M,N) Vibratome section of a wild-type (M) or mypt1 mutant (N) embryo at 24 hpf. (O) Diagram of embryo imaged in M and N. Scale bars: 50 μm in A,B,G,H,J,K,M,N; 25 μm in D,E. |
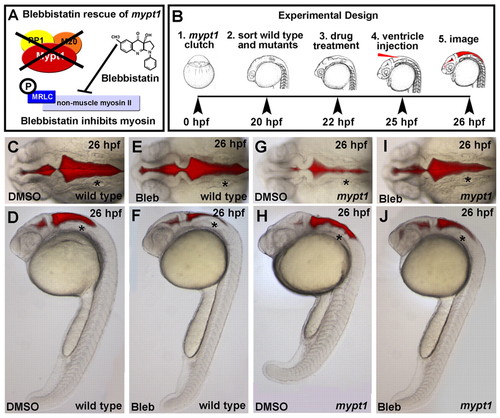
The abnormal rhombomere progression and ventricle expansion in mypt1 mutants is myosin dependent. (A) Schematic of blebbistatin rescue of the mypt1 mutant phenotype. (B) Experimental outline. Zebrafish embryos from an mypt1 heterozygous cross were sorted at 20 hpf based on an early notochord and somite phenotype in mypt1 mutants (J.H.G., unpublished). After DMSO control or blebbistatin treatments, brains were ventricle injected and imaged. Representative images from three independent experiments. (C,D) Dorsal and lateral images of a wild-type embryo treated with DMSO control; all embryos appeared wild type (n=56/56). (E,F) Dorsal and lateral images of a wild-type embryo treated with 50 μM blebbistatin; 45% had a slightly less inflated ventricle (n=36/80), but all still had normal brain morphology. (G,H) mypt1 mutant embryo treated with DMSO; all had the mutant phenotype (n=22/22). (I,J) mypt1 mutant rescued with blebbistatin; 79% of mutants were rescued (n=33/42). Asterisks indicate the ear. Anterior is to the left. |
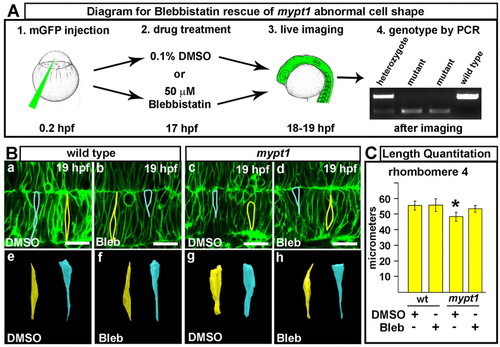
Abnormal cell shape in mypt1 mutants and rescue with myosin II inhibitor. (A) Experimental outline for blebbistatin rescue of cell shape in zebrafish mypt1 mutants. (1) Injection of memGFP mRNA into mypt1 mutant clutch. (2) Embryos at 17 hpf treated with 0.1% DMSO or 50 μM blebbistatin. (3) Live imaging of the hindbrain by laser-scanning confocal microscopy. (4) PCR identification of the wild-type and mypt1 mutant embryos imaged. (B) Blebbistatin (bleb) rescue results. (a,e) Wild-type embryo treated with DMSO. Cells were outlined (a) and 3D reconstructed (e). (b,f) Wild-type embryo treated with blebbistatin. Cells were outlined (b) and 3D reconstructed (f). (c,g) mypt1 mutant treated with DMSO. Cells were outlined (c) and 3D reconstructed (g). (d,h) mypt1 mutant treated with blebbistatin. Cells were outlined (d) and 3D reconstructed (h). Images are representative of three independent experiments. At least four embryos for each treatment group were analyzed for cell shape and three to five cells were outlined from each embryo. Yellow, rhombomere cells; blue, boundary cells. Asterisks indicate the ear. Anterior is to the left. (C) Quantitation of neural tube width at the widest region of r4 (or at the boundary between r4 and r5, see Fig. S9 in the supplementary material) in embryos treated with DMSO or blebbistatin as indicated (wild type+DMSO, n=7; wild type+bleb, n=8; mypt1+DMSO, n=6; mypt1+bleb, n=5). *, P<0.01 (Mann-Whitney U-test). Scale bars: 25 μm. |
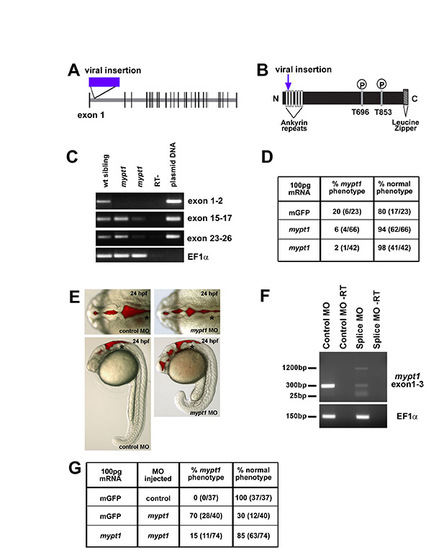
mypt1 gene, protein, mRNA rescue and morpholino phenocopy. (A) In zebrafish, mypt1 consists of 26 exons and a 3322 nt transcript that encodes a 1047 amino acid protein featuring several conserved domains. Model of the mypt1 gene with the location of the viral insertion indicated. (B) Model of the Mypt1 protein showing the viral insertion location in the ankyrin repeat domain. The N-terminus of Mypt1 contains six ankyrin repeats, which have been shown to be important for protein-protein interactions, including the interaction with protein phosphatase 1 (PP1) and for myosin phosphatase function. Without proper binding of Mypt1 to PP1, myosin phosphatase is non-functional, regardless of the phosphorylation state of Mypt1. There are two conserved threonine residues at amino acids 696 and 853, which have been demonstrated to be the sites for phosphorylation and inhibition of the myosin phosphatase, and finally a C-terminal leucine zipper motif that is also important for other protein-protein interactions. (C) RT-PCR from single wild-type and mutant embryos over the regions indicated. RT-PCR primers for cDNA analysis of mutant embryos include: exon 1 forward, 5′-AAGGTGAAGTTCGACGATGG-3′ and exon 2 reverse, 5′-GGGGATCCAGCCTTCATTAT-3′; exon 15 forward, 5′-GAACTGTCCTGGGCTCTGAC-3′ and exon 17 reverse, 5′-TCCTGGAGGTCTGTCAATGTC-3′; exon 23 forward, 5′-GGAGAAGGCCACACAGAGAC-3′ and exon 26 reverse, 5′-CGCTCCGTTTTCATCCTTTA-3′. RT-PCR control primers were: EF1α forward, 5′-GATGCACCACGAGTCTCTGA-3′ and EF1α reverse, 5′-TGATGACCTGAGCGTTGAAG-3′. mypt1 appears to be a hypomorphic phenotype as the phenotype can vary in severity from embryo to embryo (data not shown). The transcript was detected, by RT-PCR in different regions of the gene, at different levels in different mutants. (D) mRNA injection and rescue of mypt1 mutants. For mRNA rescue experiments, single-cell embryos were injected with 100 pg mRNA and assayed for phenotype at 24 hpf. Zebrafish mypt1 (NM_001003870) full-length cDNA was obtained by RT-PCR from 24 hpf embryos with the following primers: forward primer (-9 to +10, relative to the start site), 5′-CTCGAGGGGATGAAGATGG-3′ and reverse (+3302 to +3322), 5′-AAACGCAGTGGTTCTGTGTG -3′. The PCR product was sequenced and subcloned into pCS2+ for mRNA expression. mRNA was transcribed using mMessage mMachine (Ambion). (E) Brightfield images with brain ventricle injection demonstrating that the splice site MO phenocopies the mypt1 mutants. (F) RT-PCR analysis of a single embryo to determine the effects of the splice site MO on the mypt1 gene. Primers spanning the splice site target were used, surrounding exon 1-3. RT-PCR primers for cDNA analysis of MO-injected embryos: exon 1 forward, 5′-CGACATCAACTACGCCAATG-3′ and exon 3 reverse, 5′-GGCCTCCTCTTCTGCGATA-3′. The splice site MO decreased the wild-type transcript and introduced two other transcripts. A 1200 bp transcript that included part of intron 2 and caused a frame shift that introduced a stop codon immediately following the MO target site, and a short 30 bp transcript was detected that almost completely excluded exon 2 and introduced a premature stop codon further in the sequence in exon 4. (G) Rescue of the spice site MO-injected embryos with co-injection of mypt1 mRNA. Morphants were rescued by co-injection of 100 pg of mypt1 mRNA at the one-cell stage. |
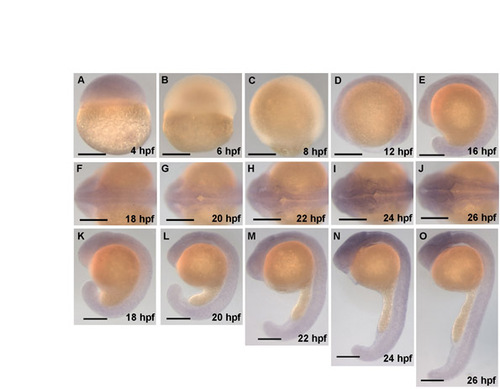
mypt1 is expressed throughout the brain during hindbrain ventricle formation. In situ hybridization showing the expression of mypt1 over time, including 18-24 hpf, during which the hindbrain ventricle forms. The in situ probe was constructed from an mypt1 cDNA fragment from 132 to 3228 bp. Forward primer (from +123 to +144 relative to the start site), 5′-CGAAGGTGAAGTTCGACGATG-3′ and reverse primer (+3228 to +3248), 5′-TGTCGCCATTGTCTCGTGTT-3′. This fragment was subcloned into pGEM using the pGEM T-Easy Vector System Kit (Promega). In situ hybridization was conducted using standard procedures. (A-E) Lateral views at the stages indicated. (F-J) Dorsal views at the stages indicated. (K-O) Lateral views of the corresponding dorsal views from embryos in panels directly above. Scale bars: 200 μm. |
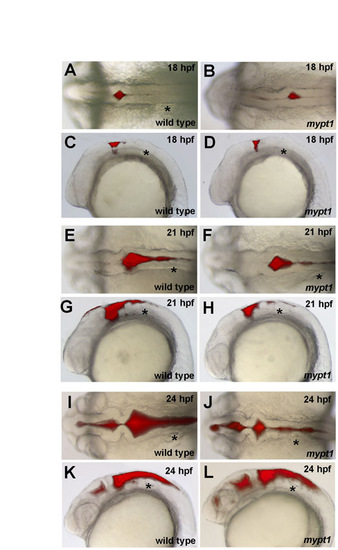
Ventricle injection time course of wild type and mypt1 mutants. Gross morphology was analyzed by ventricle injection followed by brightfield and fluorescence microscopy (n>10 for each panel). (A-D) At 18 hpf, wild-type and mypt1 mutant embryos had similar brain morphology. (A,B) Both had an initial ventricle opening at the r0/r1 boundary. (C,D) Rhombomere morphology was apparent in the lateral view. (E-H) At 21 hpf, hindbrain formation in mypt1 mutants also looked similar to that in wild-type embryos. (E,F) The hindbrain was separated within r1 and r2, and open in more posterior regions but not fully separated. (G,H) At this time, the rhombomeres were also prominent as seen from the lateral view and appeared normal in mypt1 mutants. (I-L) At 24 hpf, a clear defect was apparent in mypt1 mutants compared with the wild type, both dorsally (I,J) and laterally (K,L). Asterisk indicates ear. |

Cell proliferation and cell death are normal in the hindbrain of mypt1 mutants. Phospho-histone H3 (PH3) labeling was conducted as previously described (Lowery and Sive, 2005). Apoptosis was detected by the TUNEL method using the Apoptag Kit (Chemicon) according to the provided protocol using fluorescent detection of apoptotic cells. Embryos were counterstained with propidium iodide to label nuclei and imaged by laser-scanning confocal microscopy (Zeiss LSM510). (A,D,B,E) Wild type (A,D) and mypt1 mutants (B,E) were stained for PH3 or TUNEL (green) and the nuclei were counterstained with propidium iodide (red). (A) PH3 staining in a 24 hpf wild-type embryo. (B) PH3 staining in a 24 hpf mypt1 mutant embryo. (C) Quantitation of green PH3-positive cells versus total cell number; the data are expressed as the percentage of PH3-positive cells. Wild type, n=6; mypt1, n=6. (D) TUNEL staining in a 24 hpf wild-type embryo. (E) TUNEL staining in a mypt1 mutant embryo. (F) Quantitation of TUNEL-positive cells versus total cell number in wild type and mypt1 mutants; the data are expressed as the percentage of TUNEL-positive cells. Wild type, n=8; mypt1, n=6. Anterior is to the left in all images. There were no significant differences between wild-type embryos and mutants analyzed with either PH3 or TUNEL. Asterisk indicates ear. |
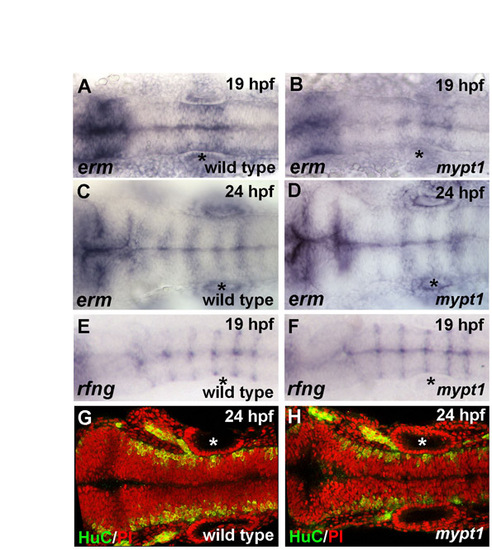
Hindbrain gene expression and neuronal differentiation are normal in mypt1 mutants. Gene expression patterns appeared normal for all marker genes examined in mypt1 mutants versus wild type. (A-D) erm in situ hybridization in wild type (A,C) and mypt1 mutants (B,D) at 19 and 24 hpf, respectively. Gene expression is normal in mypt1 mutants and changes normally over this time period. (E,F) 19 hpf wild-type embryos and mypt1 mutants were analyzed for rfng expression by in situ hybridization. rfng is expressed in rhombomere boundaries in wild-type embryos and was normal in mypt1 mutants. (G,H) Postmitotic neurons were labeled for HuC (green) and nuclei were counterstained with propidium iodide (red). Anterior is to the left in all images. Normal gene expression for wnt1, krox20, pax2a, zic1 and shh was also seen (data not shown). Asterisks indicate ear. |
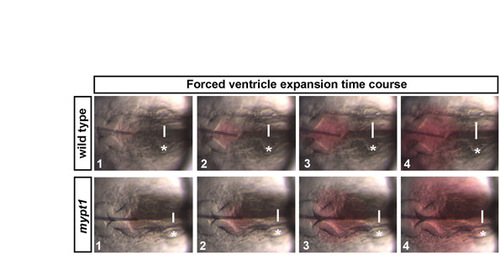
The expandability of the hindbrain neuroepithelium. Time series of images in wild type or mypt1 mutants before and during forced inflation. The wild-type neuroepithelium was expanded to 1.5 times the original size by fluid injection, whereas mypt1 mutant neuroepithelium was only expanded to 1.3 times its original size. White lines indicate point where the hindbrain ventricle width was measured. Asterisks indicate the ear. Anterior is to the left in all images. |
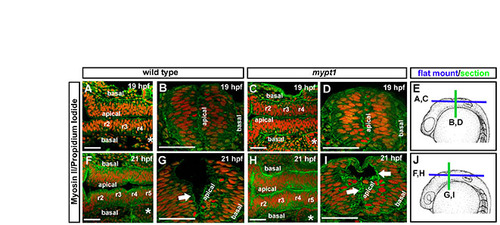
Early non-muscle myosin II localization in mypt1 mutants. Fixed wild-type and mypt1 mutant embryos were stained with non-muscle myosin II antibody (green) and counterstained with propidium iodide to label nuclei (red). Representative images from four independent experiments. For each experiment, two to three embryos were imaged at each stage. (A,B) Whole-mount (A) and vibratome section (B) of a wild-type embryo at 19 hpf. (C,D) Whole-mount (C) and vibratome section (D) of mypt1 mutant at 19 hpf. (E) Diagram of embryo stage and region imaged in A-D. (F,G) Whole-mount (F) and vibratome section (G) of wild-type embryo at 21 hpf. (H,I) Whole-mount (H) and vibratome section (I) of mypt1 mutant embryo at 21 hpf. (J) Diagram of embryo stage and regions imaged in F-I. (A,C,F,H) Anterior is to the left. (B,D,E,G,I,J) Dorsal is to the top. Asterisks indicate ear. Scale bars: 50 μm. |