
- Title
-
Disruption of angiogenesis and tumor growth with an orally active drug that stabilizes the inactive state of PDGFR{beta}/B-RAF
- Authors
- Murphy, E.A., Shields, D.J., Stoletov, K., Dneprovskaia, E., McElroy, M., Greenberg, J.I., Lindquist, J., Acevedo, L.M., Anand, S., Majeti, B.K., Tsigelny, I., Saldanha, A., Walsh, B., Hoffman, R.M., Bouvet, M., Klemke, R.L., Vogt, P.K., Arnold, L., Wrasidlo, W., and Cheresh, D.A.
- Source
- Full text @ Proc. Natl. Acad. Sci. USA
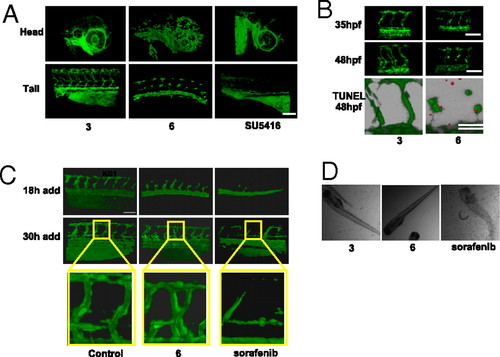
Compound 6 inhibits angiogenesis in the zebrafish. (A) Effect of 6 on angiogenesis in transgenic fli1-egfp zebrafish embryos. Embryos were treated with 1 μM 6 or SU5416, or 10 μM 3 from 20 until 48 hpf. Representative 3D reconstructions of the blood vasculature are shown for both the head and tail regions of the embryo. Designations for the major vessels in the head and tail of the zebrafish embryo at 48 hpf are available in Fig. S3A. (B) Disruption of lumen formation in the zebrafish during late vessel maturation. Zebrafish treated with either 1 μM 6 or 10 μM 3 from 20 to 48 hpf were imaged at 35 and 48 hpf. (Bottom) 6 induces apoptosis in the intersegmental vessels in the zebrafish. Shown is a 3D overlap reconstruction of the GFP-expressing intersegmental vessels with TUNEL-positive nuclei at 48 hpf (shown in red). Representative phase-contrast views as well as quantification of intersegmental vessel volumes from A and B can be found in Fig. S3 B–D, respectively. (C) Time course of drug addition to zebrafish. Compounds (2.5 μM 3 or 6, 1 μM sorafenib, or DMSO as control) were added at either 18 or 30 hpf (left on the embryos for the duration of the experiment), and intersegmental vessels were imaged H24 h after the time point corresponding to drug addition. At 30 hpf, the zebrafish embryos established early vessels with evident lumens. Compound 6 and sorafenib were added to evaluate their effect on preexisting vasculature. (D) Phase-contrast images of zebrafish treated with 3, 6, or sorafenib (same concentrations as in C). The images demonstrate that embryos treated with 3 and 6 are viable whereas sorafenib causes death. n = 4–6 zebrafish embryos per condition for all treatments. (Scale bars, 100 μm.) EXPRESSION / LABELING:
|

Combination of imatinib and GW 5074 inhibits angiogenesis similarly to compound 6. (A) Effect of 3, 6, vatalanib, imatinib, GW 5074, and a combination of imatinib (PDGFR inhibitor) and GW 5074 (RAF inhibitor) on intersegmental vessel formation in Tg:(fli1-egfp) zebrafish embryos. Embryos were treated with DMSO, 5 μM 3, 5 μM 6, 1 μM vatalanib, 5 μM imatinib (Im), 1 μM GW 5074 (GW), and the combination of 5 μM imatinib and 1 μM GW 5074 (Im + GW) from 16 until 48 hpf. Z stacks from laser-scanning confocal microscopy are shown depicting formation of the intersegmental vessels at 48 hpf. n = 6 embryos/treatment. (Scale bar, 100 μm.) (B) HUVECs were cocultured with hTERT-human hepatic stellate cells in a 3D collagen matrix in the presence of complete EBM-2 medium to monitor pericyte-associated endothelial tube formation. The stellate cells were labeled with 10 μg/mL red fluorescent dye [DiIC(3); BD Biosciences] for 1 h before the start of the experiment. Inhibitors were added to the cocultures 6 h postseeding at the following concentrations: DMSO, 2.5 μM 3, 2.5 μM 6, 1 μM imatinib (Im), 0.5 μM GW 5074 (GW), and the combination of 1 μM imatinib and 0.5 μM GW 5074 (Im + GW). The endothelial tubes were stained at 24 h by adding 2 μL FITC-labeled Ulex europaeus lectin (Vector Labs) per well. Images were acquired 48 h postseeding of the cells. One representative panel from three independent experiments is shown. Green, FITC-lectin-labeled endothelial cells; red, DiIC(3)-labeled stellate cells. Inset in each panel displays a higher-magnification view of the endothelial cell/stellate cell interactions. (Scale bar, 200 μm.) (C) Tube lengths were measured using MetaMorph software for each tube for all 10 fields that were acquired. The % pericyte-covered tube length was calculated from the ratio of tube length sums for the tubes with and without pericyte contact. Error bars are reported as ± SEM of two wells per group. *P < 0.05 compared to DMSO group. EXPRESSION / LABELING:
|
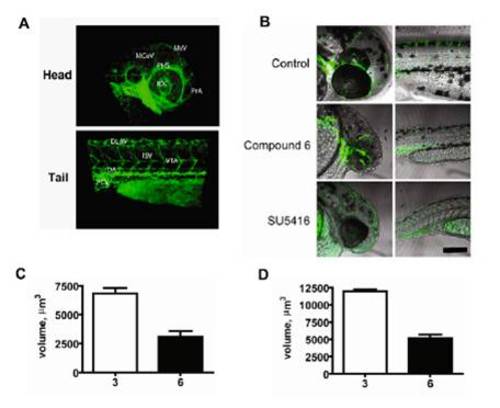
Labeling of the Tg:fli1-egfp zebrafish vasculature and quantification of the drug treatment effect on the intersegmental vessel volume. (A) Images are taken from Fig. 3A with major vascular structures labeled. In the head: MCeV, middle cerebral vein; MsV, mesencephalic vein; PHS, primary head sinus; IOC, inner optic circle; PrA, prosencephalic artery. In the tail: DLAV, dorsal longitudinal anastomotic vessel; DA, dorsal aorta; PCV, posterior cardinal vein; ISV, intersegmental vessel; VTA, vertebral artery. (B) Representative views of zebrafish embryos treated as in Fig. 3A (images represent merged phase and GFP fluorescence views of the head and trunk regions of Tg:fli1-EGFP embryos). (Scale bar, 200 μm.) (C) Quantification of ISV volume from embryos treated as in Fig. 3A. (D) Quantification of ISV volume from embryos treated as in Fig. 3B. To measure the ISV volume, individual ISVs were digitally isolated using the Imaris countersurface/isosurface functions. Thirty independent ISVs from four independent embryos were used for the measurement. Reported ± SEM. EXPRESSION / LABELING:
|