
- Title
-
BMP regulation of myogenesis in zebrafish
- Authors
- Patterson, S.E., Bird, N.C., and Devoto, S.H.
- Source
- Full text @ Dev. Dyn.
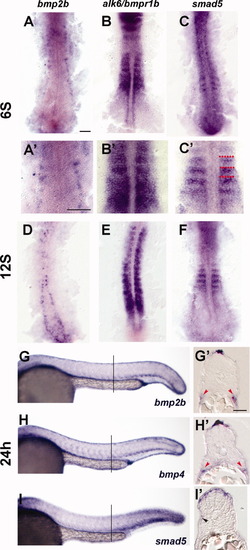
Expression of BMP pathway members in the trunk at 24 hr. A-C: Expression of BMP pathway members at 6S. D-F: Expression of BMP pathway members at 12S. G-I′: Expression of BMP pathway members at 24 hr. A: Expression of bmp2b at the 6S stage. Expression is in Rohon-Beard neurons. A′: Close-up of somites in A. B: Expression of alk6/bmpr1b is throughout the somite. B′: Close-up of somites in B. C: Expression of smad5 is in the anterior border cells (ABCs). C′: Close-up of somites in C, red dots indicate somite boundaries. D: bmp2b expression is found in Rohon-Beard cells, which have moved medially and dorsally. E: alk6/bmpr1b is expressed throughout the somites. F: Smad5 is expressed in the anterior-most cells in the newly formed somites, and more diffusely in older somites. G: Whole mount expression of bmp2b at 24 hr. Bmp2b is expressed in the dorsal and ventral trunk. G′: Transverse section of embryo labeled in whole mount for bmp2b. Bmp2b is expressed in the dorsalmost ectoderm, dorsal to the neural tube. Bmp2b is also expressed ventral to the myotome, in the presumptive lateral plate mesoderm (red arrowheads). H: Whole mount expression of bmp4 at 24 hr. Bmp4 is expressed in a pattern similar to the expression pattern of bmp2b. H′: Transverse section of embryo labeled in whole mount for bmp4. Bmp4 is expressed in the dorsal ectoderm and presumptive lateral plate (red arrowheads). I: Whole mount expression of Smad5 at 24 hr. Smad5 is expressed highly in the dorsal and ventral portions of the somite, especially in posterior somites. I′: Transverse section of embryo labeled in whole mount for smad5. High level of smad5 expression is evident in the dorsal somite, adjacent to the bmp-expressing domain. Some fainter-expressing cells are evident on the surface of the myotome (black arrowhead). Lines in F, G, and H indicate position of sections in each respective inset. Scale bars = 50 μm in A (for A-C, A′-C′); 25 μm in G′ (for G′-I′). |
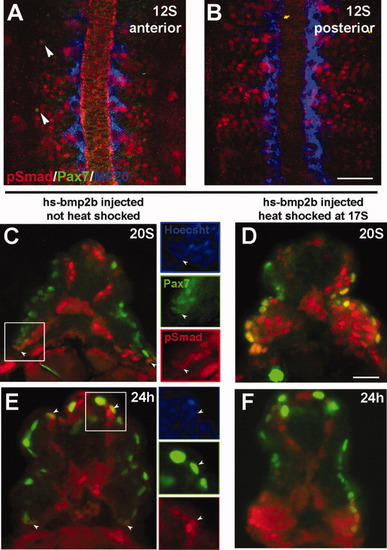
Phospho-Smad 1, 5, 8 (pSmad) distribution. A-C, E: Normal pattern of pSmad labeling. D, F: Pattern of pSmad following overexpression of Bmp2b. A: Pattern of phosphorylated Smad 1, 5, and 8 (red) in the anterior somites of 12S stage embryo. pSmad is distributed throughout the somite. A subset of lateral pSmad+ cells also express Pax7 (green, arrowheads). B: Pattern of pSmad (red) in the posterior somites of a 12S-stage embryo. C-F: Transverse sections labeled for pSmad (red) and Pax7 (green). C: At 20S, pSmad is found in Pax7+ myogenic precursors at the dorsal and ventral regions of the somite (arrowheads). Insets show a Pax7+ nucleus (green) that is also pSmad+ (red). pSmad labeling is also seen in the medial portion of the somite. D: pSmad in a 20S embryo following heat-shock induction of Bmp2b overexpression at 17S. Ectopic activation of BMP signaling is still evident at this time, including in the Pax7-expressing population (green). Because of the mosaic distribution of the plasmid DNA following injection, the pattern of ectopic activation can vary. In this case, high levels of ectopic pSmad (red) are seen in the ventral somite. E: pSmad labeling in a 24-hr embryo. A subset of Pax7+ myogenic precursors (green) at the dorsal and ventral regions of the somite are also pSmad+ (red). Insets indicate cells that are both Pax7+ and pSmad+. F: Distribution of pSmad at 24 hr following heat-shock induction of Bmp2b overexpression at 17S. A high level of ectopic BMP activation is evident throughout the somite (pSmad, red), including a high proportion of the Pax7-expressing myogenic precursors (green). Scale bars = 50 μm in B (for A,B), 25 μm in D (for C-F). |
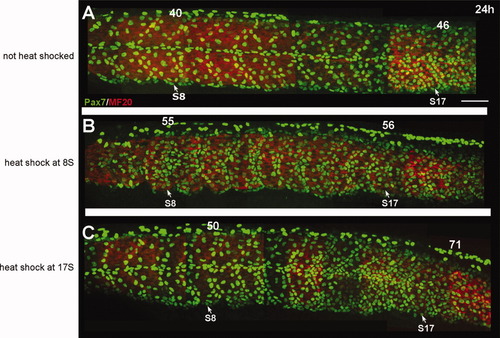
Expression of Pax7 at 24 hr following heat-shock induction of Bmp2b. A: Expression of Pax7 (green) in embryos that were injected with the hs-bmp construct, but not heat shocked. Pax7 cells are distributed along the borders of the myotome and in the horizontal myosepta. Myosin is shown in red. B: Pax7 expression (green) in an embryo that was heat shocked at 8S to induce overexpression of BMP. The number of Pax7-expressing cells is increased in somites along the anterior-posterior axis. C: Pax7 expression in an embryo that was heat shocked at the 17S stage to induce overexpression of BMP. A strong increase in the number of Pax7-expressing cells is evident in the posterior somites, particularly around somite 17. There is also a smaller increase in the number of Pax7-expressing cells in the anterior portion of the somite. Numbers above somites indicate the number of Pax7+ nuclei in that somite. Scale bar = 50 μm. |
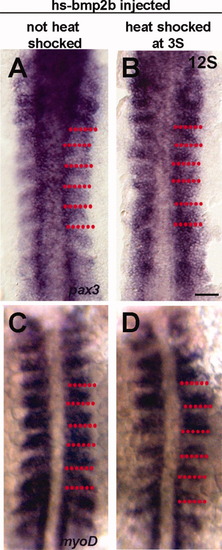
Early changes in differentiation following overexpression of Bmp2b. A: Expression of pax3 in a 12S non-heat-shocked control embryo. Pax3 is expressed by the anterior border cells (ABCs). B: Expression of Pax3 at 12S following heat-shock induction of Bmp2b overexpression at 3S. pax3 expression is no longer confined to the anterior cells, and is expressed throughout the somite. C: Expression of myoD in a 12S non-heat-shocked control embryo. Myod is expressed throughout the posterior somite, and excluded from the ABCs. D: Expression of myoD at 12S following heat-shock induction of Bmp2b overexpression at 3S. The domain of myoD expression is decreased. Red dots indicate somite boundaries. Scale bar = 50 μm. |
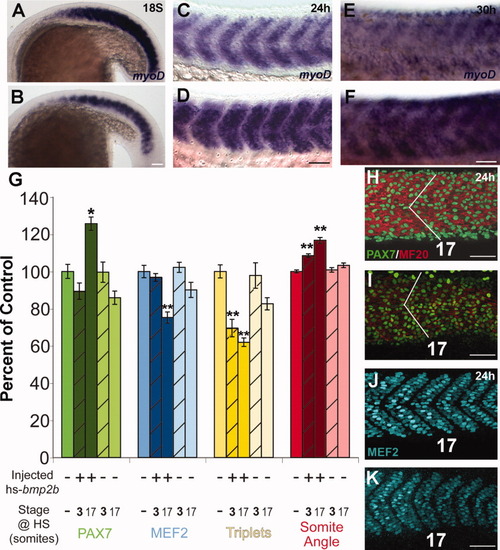
Differentiation of muscle following overexpression of Bmp2b. Differentiation of muscle following ectopic overexpression of Bmp2b. A, C, E: Normal differentiation of muscle. B, D, F: Differentiation of muscle in the presence of ectopic Bmp2b. A: Expression of myoD at the 18S stage in an embryo that was not injected or heat shocked. B: Expression of myoD at the 18S stage following heat-shock induction of Bmp2b at the 3S stage. The domain and expression level of myoD is reduced compared to the non-injected control embryos. C: Expression of myoD at the 24-hr stage in an embryo that was injected with the hs-bmp2b construct, but was not heat shocked. At 24 hr, myoD expression has begun to decrease in the somite as the cells differentiate into myosin-expressing fibers, and is present in a stripe in the anterior-posterior middle of the myotome. D: Expression of myoD at the 24-hr stage following heat shock induction of Bmp2b at the 3S stage. The domain of myoD is increased compared to non-heat-shocked control embryos and resembles the domain of expression in control 18S embryos. E: Expression of myoD at the 30-hr stage in an embryo that was injected with the hs-bmp2b construct, but was not heat shocked. F: Expression of myoD at the 30-hr stage following heat-shock induction of Bmp2b at the 3S stage. The level of myoD expression is higher than in non-heat-shocked control embryos, and appears similar to a 24-hr control embryo. G: Maturity assays for somite 17 after heat shock, compared to control. All measurements are expressed as a percentage of control (mean set to 100%). Measurements were: total number of Pax7+ cells (green bars), total number of MEF2+ cells (blue bars), total number of muscle fibers with triplet nuclei (yellow bars), and somite angle (red bars). Medium color bars (first in each set), control; dark bars, bmp2b-injected; light bars, non-injected. Bars for 3S heat-shocked embryos are hatched. *Significant difference from control at P < 0.001; **difference from control at P < 0.0001; lack of an asterisk indicates no statistical difference from control. A significant increase (∼25%) in Pax7+ cells was seen in bmp2b-injected 17S heat-shocked embryos (compare H and I), while all others were not different from control. A significant decrease (∼25%) was seen in MEF2+ cells in bmp2b-injected 17S heat-shocked embryos, while all others were not different from control (compare J and K). A significant decrease (20-40%) in number of fibers with triplet nuclei was seen in bmp2b-injected embryos when heat shocked at either 3S or 17S. A significant increase in somite angle (10-20%) was seen in bmp2b-injected heat shocked embryos at either 3S and 17S (compare angle in H and I). All error bars = standard error. N=10 for each group within each category. H-K: Changes in cell composition and morphology of somite 17 at the 24-hr stage in control (H,J) and hs-bmp2b-injected embryos heat shocked at stage 17 (number indicates somite number). H: Pax7 (green) and MF20 (red) antibody staining in a 24-hr stage control embryo. I: Pax7 (green) and MF20 (red) antibody staining in a hs-bmp2b-mCherry injected 17S heat-shocked embryo. Note the increase in both number of Pax7+ cells and somite angle (white lines). J: MEF2 antibody staining in a 24-hr stage control embryo (same individual as H). K: MEF2 antibody staining in a hs-bmp2b-mCherry-injected 17S heat-shocked embryo (same individual as I). Note the decrease in the number of MEF2+ cells. Scale bars = 50 μm. |

The effect of inhibition of BMP signaling on muscle differentiation. A: Expression of Myogenin (MGN, red) and Pax7 (green) at 24 hr in an uninjected embryo. B: Expression of Pax7 (green) and MGN (red) at 24 hr following heat-shock induction of Chordin at the dome stage. Somitic Pax7 expression is still apparent. C: Normal expression of myoD at 12S. D: Expression of myoD at 12S following heat-shock induction of TBR at 3S. Inhibition of BMP signaling with TBR does not change the early expression of myoD compared to WT siblings. E: Quantification of pSmad labeling in 22S embryos following heat-shock induction of TBR at 18S. The number of pSmad-expressing cells in embryos containing the transgene (red, hatched) is reduced by approximately 40% compared to the WT siblings (red, solid). There is no significant change in the number of pSmad/Pax7 double (yellow, hatched) -labeled cells, or the number of Pax7 (green, hatched) -expressing cells compared to the WT siblings (solid bars). N=5 for all groups F: Quantification of Myogenin-expressing cells at the dorsal and ventral thirds of the somite following heat shock of the TBR clutch analyzed in E. There is no significant change in the number of cells expressing Myogenin (red, hatched), Pax7 (green, hatched), or both Myogenin and Pax7 (yellow, hatched) in transgenic embryos when compared to WT siblings (solid bars). N = 5 for all groups. Scale bars = 50 μm. |