
- Title
-
Phosphorylation of Junb family proteins by the Jun N-terminal kinase supports tissue regeneration in zebrafish
- Authors
- Ishida, T., Nakajima, T., Kudo, A., and Kawakami, A.
- Source
- Full text @ Dev. Biol.
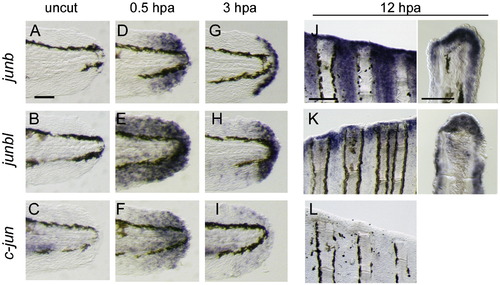
Activation of jun-family gene transcription during regeneration. (A–I) Expression of junb (A D, D, G), junbl (B, E, H), and c-jun (C, F, I) at uncut 0 hpa (A–C), 0.5 hpa (D–F) and 3 hpa (G–I) of larval finfold regeneration. (J–L) Expression of junb (J), junbl (K), and c-jun (L) genes at 12 hpa of adult fin regeneration. Respective gene expressions were detected in whole-mounts (left panels), and their cellular localizations were assessed in sections (right panels). The scale bar represents 100 μm in (A) and (J, left panel), and 30 μm in (J, right panel). |
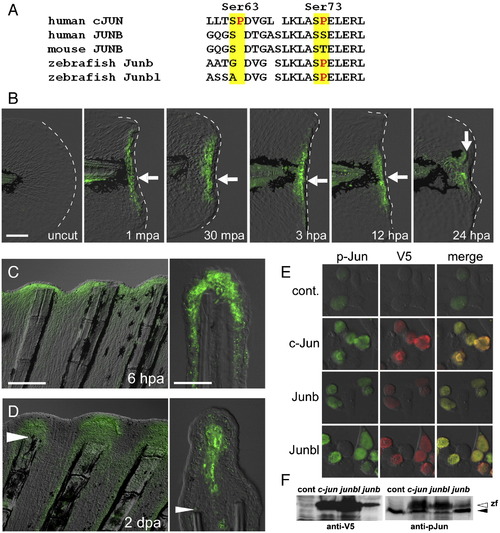
Phosphorylation of Jun proteins during the finfold and fin regenerations. (A) Comparison of amino acid sequences around the phosphorylation target site (Kallunki et al., 1996) of the human cJUN (GenBank NP_002219) with the corresponding regions of Junbs from human (GenBank CAG33122), mouse (AAA74916), and zebrafish (Junb, NM_213556; Junbl, NM_212750). (B) Anti-pJun antibody staining of regenerating larval finfold. Staining was not seen in the uncut finfold, but was detected (arrows) from 1 mpa to stages later than 24 hpa. Note that the signal was limited in cells close to the amputation plane within the domains of mRNA expression (see Figs. 1D–F). At 24 hpa, the signal was localized in the mesenchymal cells corresponding to the blastema cells expressing the junbl gene. (C, D) Anti-pJun antibody staining during adult fin regeneration at 6 hpa (C) and 2 dpa (D). At 6 hpa, the signal was observed in the epidermal cells; however at 2 dpa, the signal was localized in the growing blastema cells. Arrowheads in (D) mark the site of amputation. (E) Detection of the V5-tagged zebrafish c-Jun, Junb and Junbl proteins expressed in HEK293T cultured cells with anti-pJun antibody. The weak fluorescent signal for anti-pJun in the untransfected cells (top row) reflects the endogenous human JUN proteins. The expressed fish c-Jun, Junb and Junbl proteins were reactive with the anti-pJun antibody. (F) Western blot analysis of expressed zebrafish Jun proteins. The lower band in the right side panel (solid arrowhead) represents the endogenous human Jun proteins. The open arrowhead indicates the zebrafish Jun proteins that reacted with anti-V5 and anti-pJun antibodies. The scale bar represents 100 μm in (B) and (C, left panel), and 30 μm in (C, right panel). EXPRESSION / LABELING:
|
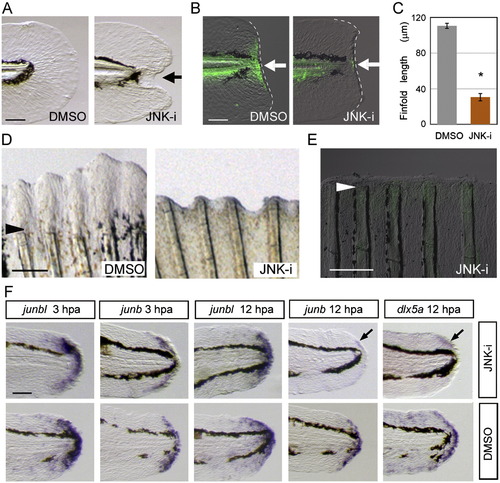
Necessary roles of Jun protein phosphorylation by JNK for regeneration. (A) Impairment of finfold regeneration by inhibiting JNK signaling with SP600125 (5 μM), but not by the vehicle, DMSO (0.05%). (B) Down-regulation of Jun phosphorylation by the JNK inhibitor at 12 hpa. Arrows indicate the regeneration-dependent anti-pJun staining (left panel) and suppression by the inhibitor treatment (right panel). (C) Quantification of finfold regeneration. Regeneration was evaluated by the finfold length posterior to the notochord. Data are presented as the mean ± SEM. Statistical significance was tested by using Student′s t-test. *P < 0.001. (D) Suppression of adult fin regeneration by the JNK inhibitor at 4 dpa. (E) Down-regulation of Jun phosphorylation by the JNK inhibitor in adult fin regeneration at 2 dpa. Arrowheads in (D) and (E) indicate the site of amputation. (F) Whole-mount in situ hybridization analysis for the expression of the blastema marker, junbl, and the wound epithelium markers, junb, and dlx5a at 3 hpa and 12 hpa in the presence (upper panels) or absence (lower panels) of the JNK inhibitor (10 μM). The gene expression was unaltered by the JNK inhibitor during the early stage. However, the later expression of epithelial genes, junb and dlx5a, at 12 hpa was down-regulated (arrows; n = 12 and 10, respectively) in spite of the maintained expression of junbl in the blastema. Respective gene expressions were confirmed by using more than 10 larvae for each probe. The scale bar represents 50 μm in (A), (B) and (F), and 100 μm in (D) and (E). EXPRESSION / LABELING:
|
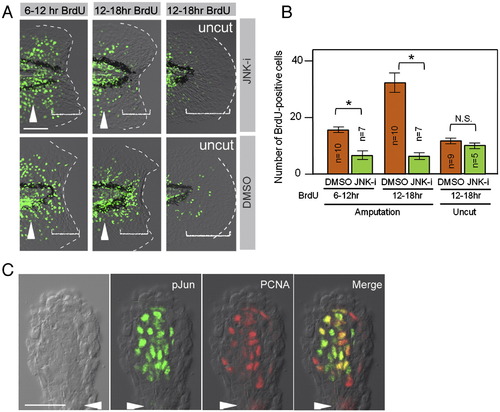
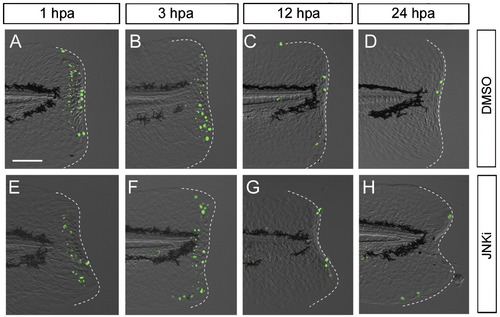
Phosphorylation of Jun proteins by JNK is required for blastema cell proliferation. (A) Decreased regenerative cell proliferation caused by the JNK inhibitor (JNK-i), but not by the vehicle (DMSO). Cell proliferation was detected by BrdU incorporation at 6–12 hpa, 12–18 hpa, and in the uncut finfold. As the regeneration-dependent cell proliferation overlaps with the growth-dependent one that gives rise to the adult-type fin rays (arrowheads), scoring was done in the region within approximately 50 μm from the amputation plane and/or posterior to the notochord end (bracketed areas). Note that the inhibitor treatment did not affect the growth-associated BrdU incorporation. (B) Quantification of regeneration-dependent cell proliferation. The JNK inhibition significantly reduced the regeneration-dependent cell proliferation, but not the growth-associated one seen in the uncut finfold. Error bars depict standard error of the mean (SEM). *P < 0.01. N.S., not significant. (C) Localization of pJun protein in proliferating blastema cells. Whole-mount preparation of adult regenerates at 2 dpa was double-stained with anti-pJun and anti-PCNA antibodies. Most of the PCNA-positive proliferating cells (G1∼S phase of cell cycle) were also pJun positive. Arrowheads indicate the plane of amputation. The scale bar represents 50 μm in (A) and (C). EXPRESSION / LABELING:
|
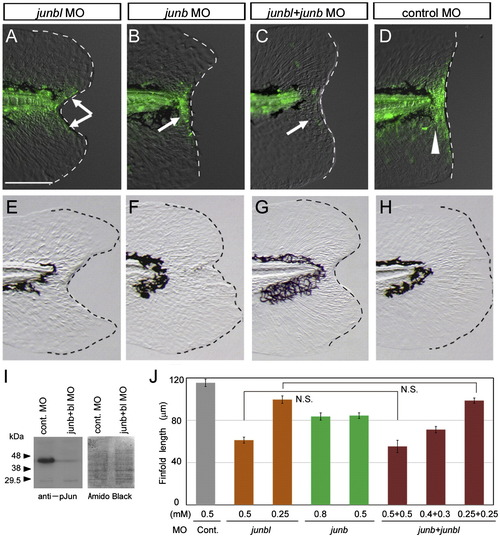
Impairment of regeneration by the knockdown of Junbl or Junb. (A–D) Reduction in pJun level by knockdown of junbl or junb. In larvae injected with junbl (A) or junb (B) MOs into fertilized eggs, a reduction in the level of pJun at 12 hpa was observed in mesenchymal or epithelial regions, respectively (arrows), whereas the standard control MO (D) did not affect the level (arrowhead). The junbl + junb double knockdown abolished the pJun (C; n = 10), indicating that the knockdown of junbl and/or junb effectively reduced their corresponding protein levels. (E–H) Phenotypes of junbl and junb knockdown at 3 dpa (also see Supplementary Table 1). The junbl knockdown displayed a severe regeneration defect (E), whereas the junb knockdown showed a deformed finfold phenotype accompanying a significant finfold growth (F). The double knockdown produced the same phenotype as the junbl knockdown (G). Although the junbl morphant had a slightly skinny morphology (data not shown), the overall morphology and vitality of these morphants were nearly normal. The scale bar represents 100 μm in (A). (I) Western blot analysis of Junb/bl protein level in the junb + junbl double knocked down larvae (0.5 mM + 0.5 mM). The posterior tissue up to 5 somite segments was collected at 6 hpa, and the Junb/bl protein was detected with the anti-pJun antibody. A duplicated filter was stained with the Amido Black as a loading control. (J) Quantification of regeneration in the knocked down larvae. Regeneration was evaluated by the finfold length posterior to the notochord. Data are presented as the mean ± SEM. Statistical significance was tested by using Student′s t-test. In all cases of junbl and/or junb MO injections, regeneration was significantly reduced (P < 0.001). However, in larvae in which junb and junbl were knocked down, the junb MO had no synergetic effect on junbl MO. N.S., not significant. |
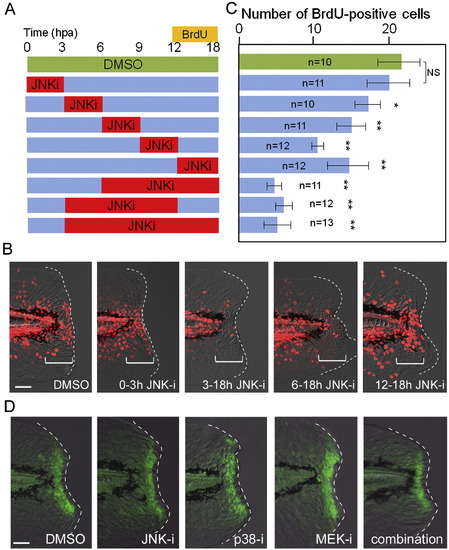
Temporal requirement of JNK signaling for finfold regeneration. (A) Experimental scheme of inhibitor shift assay to determine the temporal requirement of JNK signaling during regeneration. The JNK inhibitor (5 μM) or DMSO (0.05 %) was applied at different time windows, and proliferating cells were labeled by BrdU at 12–18 hpa. (B) Representative results of BrdU labeling after temporal inhibition of JNK signaling. The regeneration-dependent cell proliferation (bracketed regions) was not significantly reduced by the early inhibitor treatment during 0–3 hpa. (C) Quantification of cell proliferation. In all cases except the inhibitor application at 0–3 hpa, the inhibitor treatment significantly reduced the regeneration-dependent cell proliferation. Error bars depict SEM. *P < 0.05; **P < 0.01; N.S., not significant. (D) Insensitivity of early Jun phosphorylation to the MAPK inhibitors. The early Jun phosphorylation at 0.5 hpa was examined after treatment with inhibitors of JNK, p38, MEK1/2, or their combination. All inhibitors were used at 10 μM, starting the treatment 1 h before amputation. The control DMSO was added at 0.1%. None of the inhibitors had a significant inhibitory effect on early Jun phosphorylation. We also tested another p38 inhibitor, SB203580, and obtained the same result. Note that the epithelial tissue contraction by the actin cables around the stump was neither disrupted by these inhibitors. The scale bar represents 50 μm in (B) and (D). |
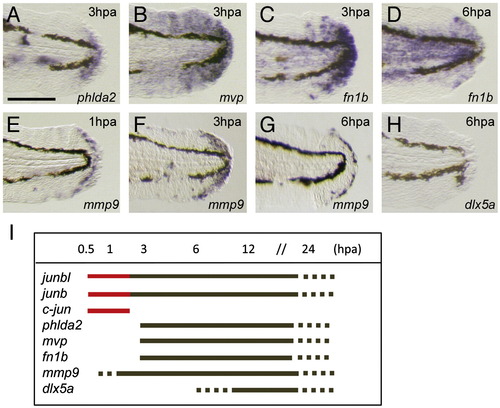
Onset of regeneration-related gene expression during finfold regeneration. (A–H) Whole-mount in situ hybridization analysis. The expression of regeneration-response genes phlda2 (A), mvp (B), and fn1b (C, D), mmp9 (E–G), and (H) was observed after 1 hpa (E), 3 dpa (A–C, F) or 6 hpa (D, G, H). The induction of mmp9 and fn1b was slightly earlier (approximately 50% of larvae exhibited a low level of gene expression at 1 hpa). In contrast to the expression of these genes, that of dlx5a, one of the epithelial markers ([Kawakami et al., 2004] and [Yoshinari et al., 2009]), was never observed at 6 hpa (H). Gene expression was examined by using more than 10 larvae. (I) A summary of temporal gene expression during regeneration. The red color indicates the unique immediate early expression of jun family genes. The scale bar represents 100 μm in (A). |
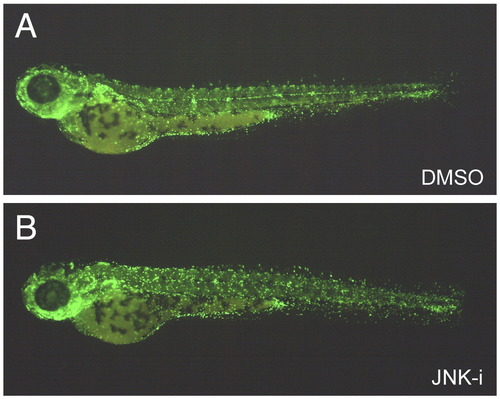
Normal overall cell proliferation in the presence of JNK inhibitor. (A, B) BrdU incorporation. Irrespective of the absence (A) or presence (B) of the JNK inhibitor, the overall BrdU incorporation in the trunk and head regions was not significantly affected. |
JNK Inhibitor does not affect apoptosis during regeneration. (A–H) Detection of apoptotic cells by TUNEL staining in the absence (A–D) or presence (E–H) of the JNK inhibitor. Immediate apoptosis occurred up to 3 hpa (A, B, E, F), but the number of apoptotic cells decreased thereafter (C, D, G, H). The JNK inhibitor did not affect the apoptosis in both phases. In all cases, 9–12 larvae were examined. The scale bar represents 50 μm in (A). |
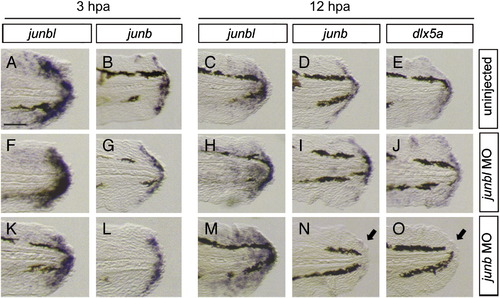
Expression of blastema and wound epithelium markers in the junb or junbl morphants at 3 hpa and 12 hpa. (A, C, F, H, K, M) junbl, (B, D, G, I, L, N) junb, and (E, J, O) dlx5a. Comparing with the normal expression of respective genes (A–E), the junbl morphants retained a nearly normal gene expression at 3 hpa (F, G) and 12 hpa (H–J). However, in the junb morphants, the expression of junb and dlx5a in the wound epithelium was not maintained at 12 hpa (arrows in N, O), while the junbl expression in the blastema normally occurred as in the junbl morphant. The down-regulation of junb expression at 12 hpa is similar to that obtained by the JNK inhibitor treatment (Fig. 3E). The scale bar represents 100 μm in (A). |
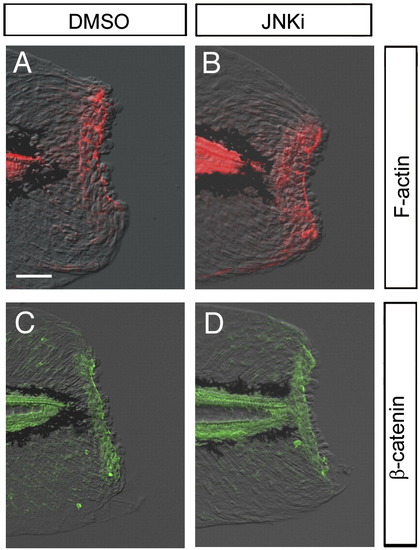
Normal wound closure in the presence of JNK inhibitor. (A, B) Detection of F-actin formation by phalloidin staining. F-actin purse string around the epithelial opening was normally formed of in the absence (A) or presence (B; n = 9) of JNK inhibitor. Note that the tissue contraction around the stump by the F-actin cables was neither affected by the JNK inhibitor. (C, D) Accumulation of β-catenin in epithelial cells around the stump. The β-catenin accumulation was also normal in the absence (C) or presence (D; n = 9) of the JNK inhibitor. The scale bar represents 50 μm in (A). |
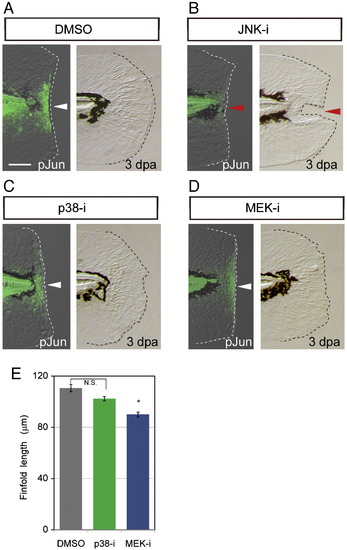
Effect of MAPK inhibitors on the later Jun phosphorylation and regeneration. (A–D) Jun protein phosphorylation in the zebrafish finfold at 12 hpa (respective left side panels) and morphological regeneration at 3 dpa (respective right side panels) in the presence of DMSO (A; 0.05%), JNK inhibitor (B), p38 inhibitor (C) or MEK1/2 inhibitor (D). As was shown in Figs. 3A and B, the JNK inhibitor impaired the Jun phosphorylation and regeneration (red arrowheads), but no apparent effect was observed with inhibitors targeting the p38 and ERK, the latter being downstream of MEK1/2 (white arrowheads). The scale bar represents 50 μm in (A). (E) Quantification of regeneration in the inhibitor-treated larvae. Regeneration was evaluated by the finfold length posterior to the notochord. Statistical significance was tested by using Student′s t-test. *P < 0.001. N.S., not significant. |
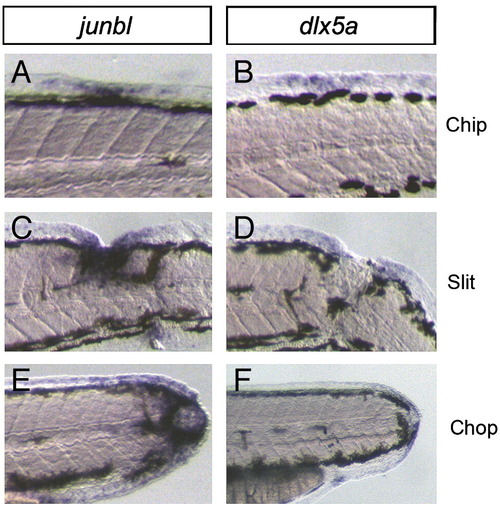
Induction of markers for the blastema and wound epithelium by various types of wounds in the trunk region. (A–F) The expressions of the blastema gene, junbl (A, C, E), and the wound epithelium gene, dlx5a (B, D, F), at 1 dpa. The zebrafish larvae were injured by a small deletion in the dorsal finfold (Chip), a larger cut into the middle of the trunk (Slit), or a complete amputation in the trunk (Chop). In all cases of wounds, the expression of junbl and dlx5a was observed around the injured sites. |
Reprinted from Developmental Biology, 340(2), Ishida, T., Nakajima, T., Kudo, A., and Kawakami, A., Phosphorylation of Junb family proteins by the Jun N-terminal kinase supports tissue regeneration in zebrafish, 468-479, Copyright (2010) with permission from Elsevier. Full text @ Dev. Biol.