
- Title
-
BBS6, BBS10, and BBS12 form a complex with CCT/TRiC family chaperonins and mediate BBSome assembly
- Authors
- Seo, S., Baye, L.M., Schulz, N.P., Beck, J.S., Zhang, Q., Slusarski, D.C., and Sheffield, V.C.
- Source
- Full text @ Proc. Natl. Acad. Sci. USA
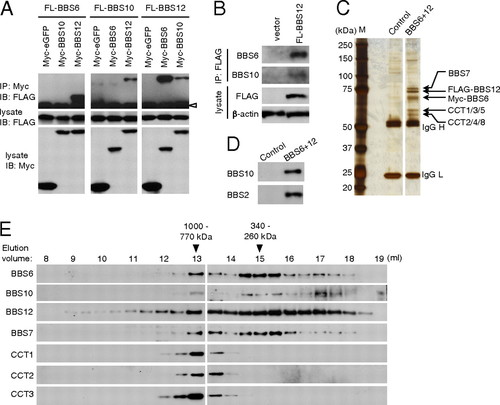
Identification of the BBS/CCT complex. (A) Interactions between BBS6, BBS10, and BBS12. Myc- or FLAG-tagged BBS6, BBS10, and BBS12 expression constructs were transfected into HEK293T cells as indicated and lysates were subjected to co-IP assay. (Middle and Bottom) Expression of each component in the lysate. (Top) Amounts of FLAG-tagged proteins coimmunoprecipitated by anti-Myc antibody. IP, immunoprecipitation; IB, immunoblotting. Open arrowhead indicates IgG heavy chain. (B) BBS6, BBS10, and BBS12 associate in vivo. HEK293T cells were transfected with 1 μg of FLAG-BBS12 in one 10-cm dish and immunoprecipitated with anti-FLAG antibody. Co-IP of endogenous BBS6 and BBS10 was probed by Western blotting using antibodies against BBS6 and BBS10. β-Actin was used for normalization of the input. (C) Purification of BBS6 and BBS12 containing protein complexes. Proteins from Myc-BBS6– and FLAG-BBS12–expressing cells (BBS6+12) were purified by sequential affinity purification and analyzed by SDS/PAGE and silver staining. Parental cells were used as a control. Size markers (M) are shown in the left and IgG heavy chain (H) and light chain (L) are marked. (D) Copurification of BBS10 and BBS2 as minor interacting proteins of the BBS/CCT complex. Proteins isolated by sequential purification were resolved in SDS/PAGE and immunoblotted for BBS10 and BBS2. (E) Chaperonin-like BBS proteins form a multisubunit complex with CCT chaperonins. Proteins partially purified by anti-FLAG affinity gel were fractionated by Superose-6 size exclusion chromatography. Elution volumes and approximate molecular weights of fractions where BBS proteins were found were denoted at Top. Void volume was -7.6 mL. Fractions were immunoblotted for Myc (BBS6), FLAG (BBS12), BBS10, BBS7, CCT1, CCT2, and CCT3. |

BBSome is not formed in Bbs6 null mouse tissues. (A) Wild-type (WT) and Bbs6 null (6KO) mouse testis extracts were fractionated by size exclusion chromatography. Elution fractions were subjected to SDS/PAGE and immunoblotting. Membranes were probed with antibodies against Bbs1, Bbs2, Bbs4, Bbs7, and Bbs8. (B) Extracts from wild-type and Bbs6 null eye were analyzed as in A. Open arrowhead indicates Bbs1; closed arrowhead indicates a cross-reacting protein. It should be noted that Bbs1 blot from Bbs6 null eye was exposed longer than that of wild-type. |

Chaperonin-like BBS proteins are required for BBSome assembly. (A) BBSome assembly in BBS6-, BBS10-, and BBS12-depleted cells. HA-BBS9 was transfected into control, BBS6-, BBS10-, and BBS12-depleted HEK293T cells, and BBSome assembly was assessed by measuring BBSome subunits associated with BBS9. (B) BBS2 deletion mutant constructs used to map BBS6- and BBS7-interacting domains. Open diamonds represent FG-GAP motifs (FG); black box indicates the coiled-coil (CC) domain; and gray box indicates the C-terminal α-helix–rich domain. Numbers represent amino acid residues. (C) Coiled-coil domain in BBS2 interacts with BBS6. HA-tagged BBS2 deletion mutants were cotransfected with FLAG-BBS6 into HEK293T cells, and lysates were immunoprecipitated with anti-HA antibodies. (D) C-terminal domain in BBS2 interacts with BBS7, but BBS6-interacting domain is required for efficient binding with BBS7. GFP-BBS7 was cotransfected with BBS2 deletion mutants. |

Requirement of CCT activity for BBSome assembly, (A) CCT chaperonins are required for BBSome assembly. HA-BBS9 was cotransfected with siRNAs against CCT1, CCT2, CCT3, or control in HEK293T cells, and BBS9-associated BBSome subunits were probed by immunoprecipitation followed by immunoblotting. (B) Chaperonin-like BBS proteins are required for the interaction between BBS7 and CCT chaperonins. Expression of BBS6, BBS10, and BBS12 was blocked by RNAi in HEK293T cells, and endogenous BBS7 was immunoprecipitated in control, BBS6-, BBS10-, and BBS12-depleted cells. Association of CCT chaperonins with BBS7 was measured by immunoblotting. (C) MO-mediated knockdown of CCT chaperonins results in Kupffer’s vesicle (KV) defects in zebrafish. Representative images of zebrafish embryos and KVs are shown at Left. (Top) Lateral view of a 10-somite stage embryo with the location of the KV circled, dorsal views; (Middle and Bottom) of a normal KV (arrow) and a reduced KV (arrowhead) at the 10-somite stage. Embryos were injected with 15 ng of indicated MOs, except for cct1, for which a 5-ng dose was used because of severe developmental defects and lethality. The percentage of embryos with reduced or absent KVs are represented for each MO treatment. Sample size and P values are in Table S2. **P < 0.01 determined by Fisher’s exact test compared with control MO-injected group. (D) Retrograde melanosome transport is delayed in cct2 morphants and genetic mutants. Melanosome transport is assessed by monitoring melanosome trafficking in the head region of zebrafish (Top). Below are representative images of the boxed area with dispersed melanosomes of dark-adapted zebrafish before epinephrine treatment (Middle) and contracted melanosomes after epinephrine induced transport (Bottom). Rate of melanosome transport to the endpoint (perinuclear distribution) is noted in seconds on y-axis. Data are represented as mean ± SEM. **P < 0.01, determined by one-way ANOVA and Tukey test. (Scale bar, 100 μm.) PHENOTYPE:
|
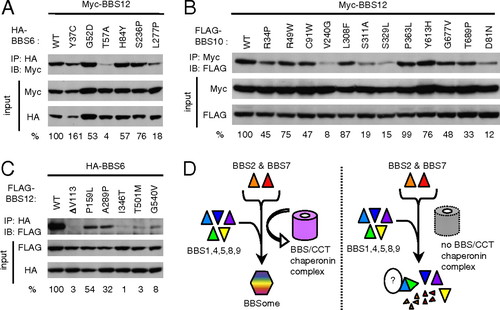
Many disease-causing missense mutations found in BBS6, BBS10, and BBS12 disrupt interactions among these proteins. (A) Interactions of BBS6 missense mutants with BBS12. HEK293T cells were transfected with Myc-BBS12 together with HA-BBS6 variants and lysates were subject to coimmunoprecipitation (IP) and immunoblotting (IB). Numbers at bottom represent ratio of coprecipitated proteins compared with wild-type protein after normalization with input. (B) Interactions of BBS10 missense mutants with BBS12. (C) Interactions of BBS12 missense mutants with BBS6. (D) Model for BBS/CCT complex function. BBS/CCT complex initially binds to BBS7 and potentially to BBS2, and mediates their association with other BBSome subunits (BBS1,4,5,8,9) to assemble BBSome. When chaperonin-like BBS genes are inactivated, at least two BBSome subunits (BBS2 and BBS7) are degraded, and the remaining BBSome subunits exist in monomeric form or aggregates with unidentified proteins. |
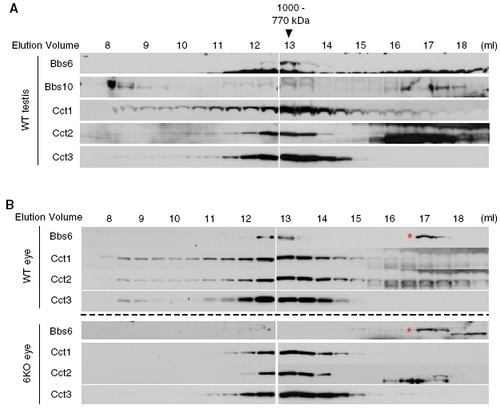
Gel filtration analysis of wild-type and Bbs6 null testis and eye extracts. Wild-type (WT) and Bbs6 null (6KO) mouse testis (A) and eye (B) extracts were subjected to size exclusion chromatography, and elution fractions were analyzed by immunoblotting. Immunoblot result from Bbs6 null eye extract indicates that the band ∼17-mL fraction is an unknown cross-reacting protein (red asterisk). It should be noted that the Bbs6 band, present at ∼13-mL fraction in wildtype, is absent in Bbs6 null eye. |
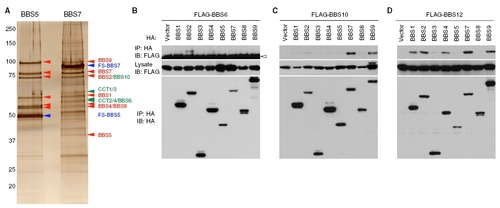
Interactions between chaperonin-like BBS proteins and BBSome subunits. (A) The BBS/CCT complex selectively associates with BBS7. BBS5 and BBS7 were tandem affinity purified from stably transfected HEK293T cells. Although purification of BBS5 copurified only BBSome subunits (red arrowheads; BBS1, BBS2, BBS4, BBS5, BBS7, BBS8, and BBS9), purification of BBS7 resulted in copurification of the BBS/CCT complex proteins (green arrowheads; CCT1-4, BBS6, and BBS10) as well as BBSome subunits. Fusion proteins that were directly tandem affinity purified are marked with blue arrowheads. Protein identity was determined by Western blotting. It should be noted that endogenous BBS5 is absent in the FS-BBS5 sample but that endogenous BBS7 is present in FS-BBS7 sample, implying that there is only one molecule of BBS5 in the BBSome but that BBS7 may exist with different stoichiometry. (B) Interaction of BBS6 with BBS2. FLAG-BBS6 was cotransfected with BBSome subunits (BBS1, 2, 4, 5, 7, 8, 9) or BBS3, and lysates were subjected to IP. Input and immunoprecipitated amounts of each protein are shown. Open arrowhead marks IgG heavy chain. (C) Interactions of BBS10 with BBS7 and BBS9. (D) Interactions of BBS12 with BBS1, BBS2, BBS4, BBS7, and BBS9. Others are the same as in B. |

Expression levels of BBS genes in Bbs6 null mouse tissues. (A) Amounts of BBS proteins (Bbs1, Bbs2, Bbs4, and Bbs7) in the eye and testis. Eye and testis extracts from wild-type and Bbs6 null mice were subjected to SDS/PAGE and immunoblotting. (B) Total RNA was extracted from wild-type and Bbs6 null eye and testis, and mRNA levels of Bbs1, Bbs2, Bbs4, and Bbs7 were compared by quantitative RT-PCR. Although there was a slight decrease in BBS gene expressions in Bbs6 null tissues, the difference was not significant. |

Suppression of BBS6, BBS10, and BBS12 expression in HEK293T cells. Expression of BBS6, BBS10, and BBS12 was blocked by RNA interference (RNAi) in HEK293T cells, and the efficiency and specificity of RNAi was confirmed by quantitative RT-PCR (A) and immunoblotting (B). For quantitative RT-PCR, relative mRNA levels of endogenous BBS genes were compared after normalization with RPL19. For immunoblotting, myc-tagged expression plasmids were cotransfected with control or corresponding BBS gene siRNAs. Equal amounts of myc-GFP expression plasmids were cotransfected and used to assess transfection efficiencies and off-target effect of RNAi. |

Localization of chaperonin-like BBS proteins and CCT chaperonins to centrosomes. (A) Indirect immunofluorescence results for BBS6, BBS10, BBS7, and GFP-BBS10. (Left) Localization of BBS proteins. (Center) Location of centrosomes (γ-tubulin). (Right) Merged images with DAPI staining for the nucleus (blue). Inlets are enlarged images of the boxed areas around centrosomes. (Scale bars, 10 μm.) (B) Indirect immunofluorescence results for CCT1, CCT2, CCT4, CCT5, and CCT8. Others are the same as in A. (C) Characterization of CCT antibodies. Immunoblotting results with antibodies against CCT1, CCT2, CCT4, CCT5, and CCT8. Each antibody recognizes a single, endogenous protein with predicted molecular weights (60.3 kDa, 57.5 kDa, 57.9 kDa, 59.7 kDa, and 59.6 kDa, respectively). |
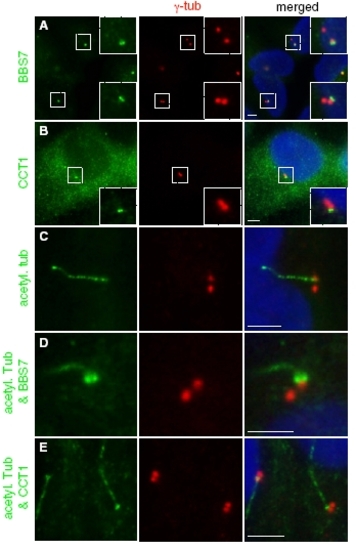
BBS7 and CCT1 specifically localize to the mature centriole. BBS7 (A) and CCT1 (B) specifically localize to only one centriole of the two in ciliated ARPE- 19 cells. The primary cilium (marked by acetylated tubulin in C) is generated from only one of the two centrioles, which is the mature or “mother” centriole and designated as the basal body. In all cases where the cilia can be unambiguously linked to one of the two centrioles, BBS7 and CCT1 staining (two green punctates in D and E) is associated with the centriole with the cilium (green whip-like structure) and within that centriole BBS7 and CCT1 are found on the side where the cilium is attached. These data indicate that BBS7 and CCT1 localize specifically to the basal body and potentially to the transition zone. However, this property does not appear to be a general feature of all BBS/CCT complex components, because we did not observe same localization in other BBS or CCT proteins tested (BBS6, BBS10, CCT4, and CCT8). |

Morphology of cct morphants and cct2 mutants. Zebrafish embryos injected with indicated MOs or wild-type and cct2 mutant embryos at 2 dpf (A) and 5 dpf (B) are shown. |

Many disease-causing missense mutations found in BBS6, BBS10, and BBS12 disrupt interactions among these proteins. (A) Missense mutation constructs used for interaction study. Missense mutations found in BBS6, BBS10, and BBS12 genes in human BBS patients were depicted (17, 24, 25). Equatorial domains are in blue, intermediate domain, in red, and apical domain, in green. Yellow boxes represent insertions, which are not present in CCT family chaperonins. Numbers represent amino acid residues. (B) Interactions of BBS6 missense mutants with BBS2 and BBS12. HEK293T cells were transfected with Myc-BBS2 or Myc-BBS12 together with HA-BBS6 variants and lysates were subject to coimmunoprecipitation (IP) and immunoblotting (IB). Numbers at the bottom represent the ratio of coprecipitated proteins compared with wild-type protein after normalization with the input. (C) Interactions of BBS10 missense mutants with BBS7, BBS9, and BBS12. (D) Interactions of BBS12 missense mutants with BBS6, BBS7, BBS9, and BBS10. Others are same as in B. Note that data presented in Fig. 5 are also shown here for comparisons with other BBS proteins. |