
- Title
-
The tbx/bHLH transcription factor mga regulates gata4 and organogenesis
- Authors
- Rikin, A., and Evans, T.
- Source
- Full text @ Dev. Dyn.
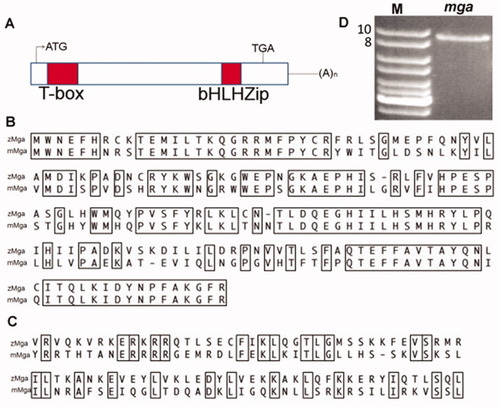
Zebrafish mga encodes a large protein with conserved T-box and bHLHzip domains. A: Schematic representation of the zebrafish mga cDNA showing the relative position of the two domains. B, C: Comparison between putative protein sequences for zebrafish (zMga) and mouse (mMga) domains, with conserved (identical) amino acids boxed. B: The T-box domain shows 68% identity. C: The bHLH domain is 34% identical. D: RT-PCR was used to confirm the size of the cDNA, including an ORF comprising 8.2 kb. The full cDNA sequence of zebrafish mga was submitted to Genbank (Accession number GU122854). |

Zebrafish mga transcripts are expressed maternally and throughout embryogenesis, with eventual restriction to anterior regions. Shown are representative embryos following in-situ hybridization using probes specific to mga, or as indicated using a control sense strand probe. A: Maternal expression at the 1-cell stage. B: During late gastrulation, transcripts are widely expressed at relatively high levels, except in the yolk syncytial layer, shown here at 75% epiboly. C-E: There is fairly ubiquitous expression during somitogenesis stages (10 somite stage) shown in a (C) lateral view or a (D) dorsal view. E: A control sense probe at the 10 somite stage. F-H: mga transcripts become restricted by 24 hpf to the anterior region including head/brain, heart, and gut endoderm (arrow in F) as shown in a lateral view (F) or dorsal views (G, H) where H shows a representative flat-mounted embryo. I-K: mga transcripts are enriched at 48 hpf in the head/brain, gut tube (arrow in I), and fin buds as shown either in (I) a lateral view or (J) a dorsal view. K: A representative embryo hybridized with the control sense probe at 48 hpf. In all cases, anterior is to the left. H, head; T, tail; HT, heart; FR, forebrain; MB, midbrain; HB, hindbrain; EY, eye; FB, fin bud; GE, gut endoderm; GT, gut tube. |
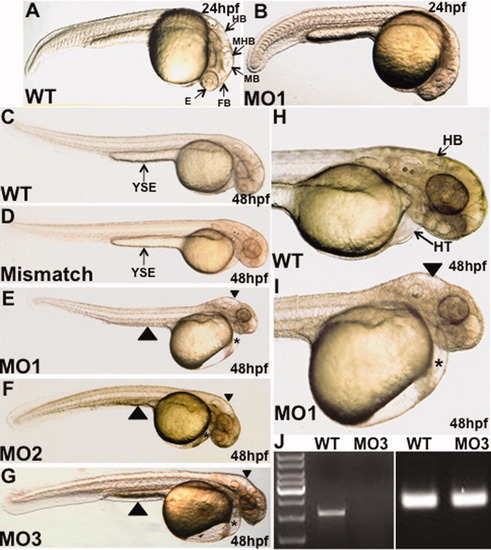
The mga morphants show defects in organogenesis of the brain, heart, and gut. Shown are representative control (wildtype: WT, or mismatch) or morphant (MO1, MO2, MO3) embryos as indicated. A,B: At 24 hpf, compared to control embryos, the morphant fails to partition normally the forebrain, midbrain, and hindbrain structures, and eye development is significantly delayed. C-I: At 48 hpf, mga morphants show a non-looping heart within a cardiac edema (asterisks), an edemic hindbrain cavity (arrowheads in E, F, G, and I), and a regression of the yolk stalk extension (large arrowheads in E-G), indicative of an endoderm defect. The morphant phenotype (brain, heart, and yolk stalk defects) shown here by representative embryos was documented for MO1 (100%, 320/320 embryos), MO2 (75%, 170/228 embryos), and MO3 (29%, 46/161 embryos). Views are lateral, dorsal to the top, and anterior to the right. HB, hindbrain; MHB, midbrain-hindbrain boundary; MB, midbrain; FB, forebrain; E, eye; HT, heart; YSE, yolk stalk extension. J: RT-PCR analysis demonstrates that the MO3 morpholino disrupts the production of normal transcript as shown by the absence of mga cDNA (left). The cDNA was prepared from control wildtype (WT) or morphant (MO3) embryos. Right panel shows equal amplification of β-actin for both WT and MO3 cDNA samples. |

Mga is required for normal heart tube looping. Shown are representative embryos derived from cmlc2:gfp transgenic reporter fish. A-D: Comparison of uninjected control (A, C) and embryos injected with MO1 (B, D) at 48 hpf. E, F: The same comparison, except at 5 dpf, showing the extreme heartstring phenotype and cardiac edema. A, B and E, F are lateral views, dorsal to the top, and anterior to the right. C, D are ventral views, anterior to the right. |

Gut organogenesis fails in the mga morphant embryos. Shown are representative control or morphant (MO1) embryos derived from ef1a:gfp transgenic fish used to image endoderm/gut morphogenesis. A, B: The comparison at 48 hpf shows relatively normal budding of the pancreas and liver suggesting that early organ budding is normal. C, D: By 3 dpf, the mga morphants show a significant decrease in the growth of liver and intestine tissue. E, F: By 5 dfp, the mga morphant embryos completely lack GFP-labeled endoderm-derived organs including the pancreas (dashed line in E), liver (dashed line in F), intestine, and swim bladder. Views are: (A, B) dorsal, anterior to the left, (C, D) lateral, dorsal to the top and anterior to the left, (E) lateral, dorsal to the top and anterior to the right, (F) lateral, dorsal to the top and anterior to the left. L, liver; P, pancreas; IB, intestinal bulb; SB, swim bladder. |
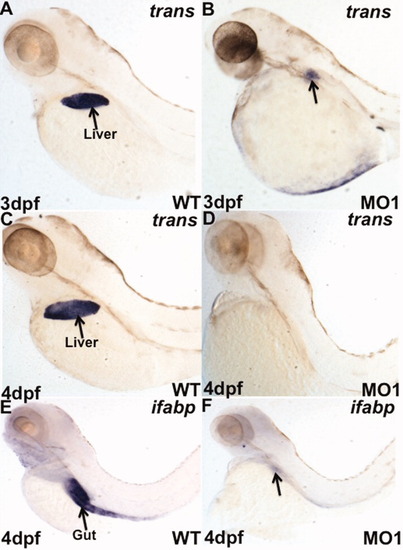
Gut organogenesis fails as shown by organ-specific markers. Shown are representative embryos labeled by in situ hybridization for the liver-specific marker transferrin (A-D) at 3 dpf (A, B) or 4 dpf (C, D) comparing wildtype (WT) control embryos with morphant (MO1) embryos (B, D). At 3 dpf, there is a small patch of transferrin-positive cells (arrow in B) but this is eliminated or regressed by 4 dpf. E,F: Shown are representative embryos labeled for the gut-specific marker ifabp at 4 dpf, comparing wildtype (WT) control (E) to morphant (F). Gut tissue is barely detectable in the morphant embryos (arrow in F). All views are lateral, dorsal to the top, and anterior to the left. EXPRESSION / LABELING:
|
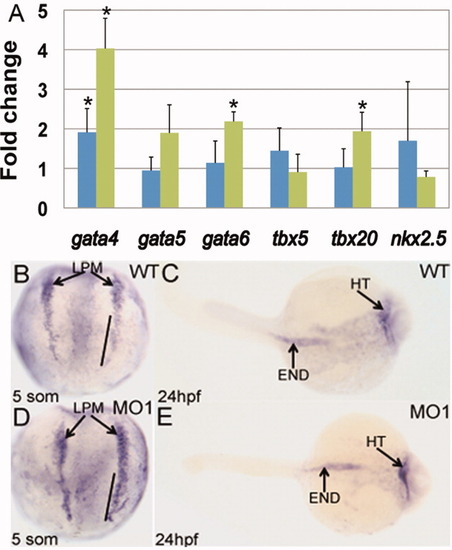
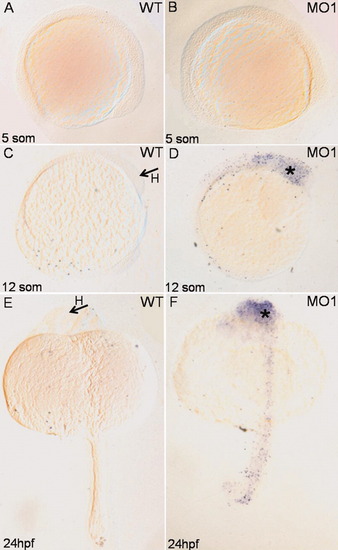
Gata4 transcript levels are increased for mga morphants in lateral plate mesoderm and the heart tube. A: Results of quantitative RT-PCR assays comparing gene expression levels for Mga morphants at 5 somites (blue) and 24 hpf (green) for the indicated cardiogenic genes. Shown is the average fold change in expression calculated from at least 3 independent experiments, with samples analyzed each time in triplicate. Samples were normalized to transcript levels for β-actin, and morphant transcript levels were quantified considering wildtype levels as 1. Student′s t-test was performed comparing standard differences of the mean. The asterisks indicate statistically significant differences (P ≤ 0.05) compared to control (at both stages in the case of gata4). B, D: In-situ hybridization using a gata4 probe shows increased gata4 transcript levels in the lateral plate mesoderm (LPM) comparing WT (B) and MO1 morphant embryos (D) at 5 somites. Note in particular the increase in the gata4 levels in the caudal region of the lateral plate mesoderm (denoted with a solid line). C, E: The gata4 transcript levels at 24 hpf appear increased in the heart (HT) of morphants (E), but not changed in the gut/endoderm (END). Views (B, D) are dorsal, anterior to the top. Views (C, E) are dorsal, anterior to the right. EXPRESSION / LABELING:
|

Knockdown of gata4 can rescue partially the mga morphant heart tube phenotype. A-C: Shown are representative embryos that are wildtype (A), injected with only the mga-specific MO1 (B), or injected first with MO1 and subsequently with the gata4 morpholino (C). The ratios shown represent the number of embryos with an apparently normal (non-edemic) phenotype in a representative experiment (which was reproduced several times). Note that the cardiac edema present in 100% of the single morphants (B) is rescued in a significant percentage (35%) of the co-injected embryos. The brain defect is also largely rescued, although in contrast, the regression in the yolk stalk extension persists. D-L: Similar experiments were carried out and imaged using embryos derived from cmlc2:gfp transgenic fish. In these experiments, initial heart looping was rescued in double-knockdown embryos compared to the mga morphants as shown in F (51/128, 40%) or I (32/77, 42%) at 3 dpf. J-L: Although it is not normal, a similar rescue (35/105, 33%) of heart looping was scored at 5 dpf. All views are lateral, dorsal to the top, and anterior to the right except for G-I, which are ventral, anterior to the right. HT, heart; YSE, yolk stalk extension. EXPRESSION / LABELING:
PHENOTYPE:
|
Depletion of mga results in increased apoptosis in the head/brain region. Shown are representative TUNEL assays analyzing control wildtype (WT) or morphant (MO1) embryos at the stages indicated. There is no apparent apoptosis at early somitogenesis stages (A, B), while at the 12-somite or 24-hpf stage there is a significant increase in TUNEL-positive cells (asterisks). Note that apoptosis was not detected in heart or gut/endoderm. Views are: (A,B) lateral, dorsal to the top, and anterior to the right; (C,D) lateral, dorsal to the left, and anterior to the top; (E,F) dorsal, anterior to the top. H, head. PHENOTYPE:
|

Knockdown of p53 can rescue the mga morphant apoptosis in the head/brain. A-D: Shown are representative morphant embryos injected with (A) 7 ng or (C) 10 ng of mga MO1 morpholino followed by TUNEL staining at 48 hpf. Note that there is a significant and dose-dependent accumulation of apoptosis in the brain mainly in the midbrain (MB) and hindbrain (HB) regions. B, D: Apoptosis is either (B) fully or (D) significantly reduced when embryos are co-injected with 1 ng of p53 morpholino. PHENOTYPE:
|
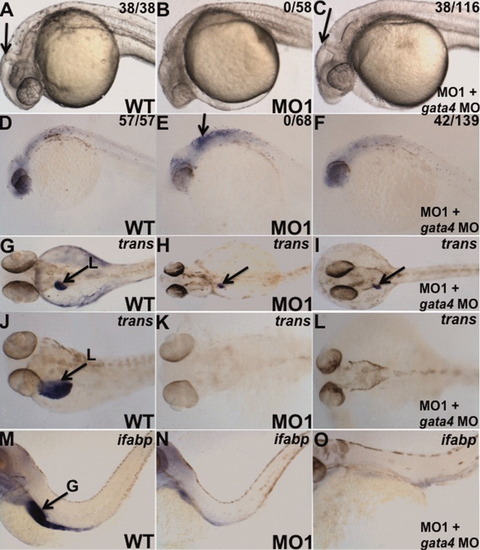
Knockdown of gata4 can rescue partially the mga morphant brain degeneration, but not the gut phenotype. A-C: Shown are representative embryos at 24 hpf that are wildtype (A), morphant injected with only the mga-specific MO1 (B), or injected first with MO1 and subsequently with the gata4 morpholino (C). The ratios shown represent the number of embryos with a grossly normal brain structure in a representative experiment (which was reproduced several times). Note that the brain degeneration present in 100% of the single morphants (B) is rescued in a significant percentage (33%) of the co-injected embryos (C). D-F: Similar results showing that the morphological rescue correlates with an abrogation of apoptosis measured by TUNEL staining. The representative 24-hpf embryos are WT (D), MO1 morphants (E), or co-injected with MO1 and gata4 morpholino (F). G-L: Shown are representative embryos stained for transcripts encoding the liver marker transferrin at 3 dpf (G-I) or 4 dpf (J-L). Embryos are wildtype (WT) control (G, J), MO1-injected (H, K), or co-injected with MO1 and gata4 morpholino (I, L). M-O: A similar analysis was performed at 4 dpf using a probe for ifabp to stain the gut. In contrast to the rescue for brain morphogenesis, knockdown of gata4 failed to rescue the liver or gut phenotype in the mga morphant background. Views (A-F) and (M-O) are lateral, dorsal to the top, anterior to the left). G-L: Views are dorsal, anterior to the left. L, liver; G, gut. EXPRESSION / LABELING:
PHENOTYPE:
|

Unillustrated author statements EXPRESSION / LABELING:
PHENOTYPE:
|