
- Title
-
Cardiac and vascular functions of the zebrafish orthologues of the type I neurofibromatosis gene NFI
- Authors
- Padmanabhan, A., Lee, J.S., Ismat, F.A., Lu, M.M., Lawson, N.D., Kanki, J.P., Look, A.T., and Epstein, J.A.
- Source
- Full text @ Proc. Natl. Acad. Sci. USA
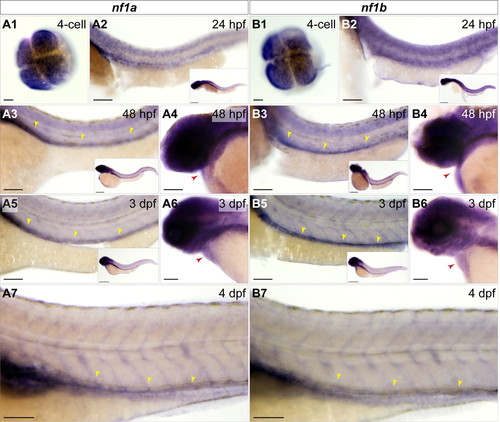
nf1a and nf1b are expressed maternally and in the developing zebrafish cardiovascular system. Whole-mount in situ hybridization for nf1a and nf1b at the four-cell stage, 24 hpf, 48 hpf, 3 dpf, and 4 dpf. (A1 and B1) At the four-cell stage, nf1a and nf1b are expressed throughout the animal pole of the developing embryo. (A2 and B2) Both genes are expressed broadly at 24 hpf (Inset), with strong expression along the spinal cord. (A3 and B3) At 48 hpf, expression of nf1a and nf1b is noted in the head and regions of the anterior trunk (Inset). Spinal cord expression of both genes persists, and positive staining is observed along the dorsal vessel for nf1a and nf1b. (A4 and B4) Cardiac expression for both genes is observed at 48 hpf. (A5 and B5) Expression of nf1a and nf1b become progressively restricted to regions of the head at 3 dpf (Insets). nf1a and nf1b expression along the dorsal vessel (A5 and B5) and in the embryonic heart (A6 and B6) persist at 3 dpf. (A7 and B7) At 4 dpf, robust vascular staining is apparent for nf1a and nf1b. (Scale bars: 25 μm; 100 μm for insets.) |

ZFIN is incorporating published figure images and captions as part of an ongoing project. Figures from some publications have not yet been curated, or are not available for display because of copyright restrictions. PHENOTYPE:
|
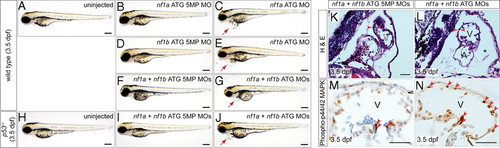
MO knockdown of nf1a, nf1b, or both together results in pericardial effusions at 3.5 dpf and increased phospho-p44/42 MAPK in cardiac tissue. Analysis of 3.5-dpf wild-type embryos (A) or embryos injected with nf1a ATG 5-mispair (5MP) MO (B), nf1b ATG 5MP MO (D), or nf1a + nf1b ATG 5MP MO (F) reveal no apparent defects in gross morphology. Treatment with nf1a ATG MO (C), nf1b ATG MO (E), or a combination of both (G), however, results in a dilation of the pericardial space. (H–J) Injection of p53-/- embryos with nf1a + nf1b ATG MO results in a gross dilation of the pericardial space (J), whereas uninjected (H) and nf1a + nf1b ATG 5MP MO-injected p53-/- embryos (I) appear normal. (Scale bars: 0.25 mm.) (K and L) Transverse sections of 3.5-dpf nf1a/nf1b combined morphant embryos reveals a thinning of the ventricular myocardium and pericardial effusion (*) when compared with controls (A, atrium; V, ventricle). (M and N) Immunohistochemical analysis of transverse sections of 3.5-dpf nf1a/nf1b combined morphant embryos reveals an increase in the ratio of phospho-p44/42 MAPK-positive cardiac cells (arrows) to the total number of cardiac cells when compared with controls. (Scale bars: 25 μm.) |
|
ZFIN is incorporating published figure images and captions as part of an ongoing project. Figures from some publications have not yet been curated, or are not available for display because of copyright restrictions. EXPRESSION / LABELING:
PHENOTYPE:
|

MO knockdown of nf1a results in vascular patterning defects at 48 and 72 hpf. (A–C) At 48 hpf, nf1a ATG MO-treated Tg(fli:egfp)y1 (endothelial-specific GFP transgenic) zebrafish embryos display gross defects in vascular development compared with control MO-treated or uninjected samples. Morphant embryos (C) display abnormal claw-like projections at the leading edge of the developing intersomitic vessels and fail to develop the dorsal longitudinal anastomotic vessel (DLAV) present in both control MO-treated (B) and uninjected (A) samples. (D–F) At 72 hpf, nf1a ATG morphant embryos display only rudimentary DLAVs and a general disorganization of the trunk vasculature (F) when compared with control MO-treated (E) or uninjected (D) embryos. (Scale bars: 25 μm.) |
|
ZFIN is incorporating published figure images and captions as part of an ongoing project. Figures from some publications have not yet been curated, or are not available for display because of copyright restrictions. |
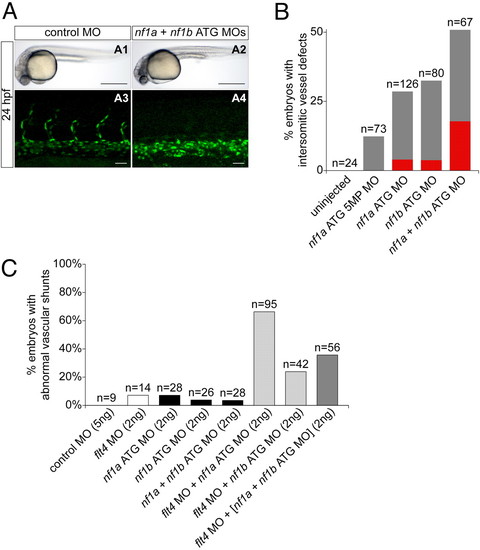
MO knockdown of nf1a, nf1b, or both together result in vascular defects at 24 at 48 hpf. (A and B) Analysis and quantification of vascular defects at 24 hpf in uninjected and morphant Tg(fli:negfp)y7 (endothelial-specific nuclear GFP transgenic) zebrafish embryos. Control MO- (A1) and combined nf1a/nf1b MO-treated (A2) zebrafish embryos appear similar by gross morphological analysis at 24 hpf. (Scale bars: 500 μm.) Development of intersomitic vessels is deficient at 24 hpf in nf1a/nf1b combined morphants (A4) when compared with controls (A3). (Scale bars: 25 μm.) (B) Intersomitic vessel formation between somites 17–30 at 24 hpf was scored as absent (red), intermediate (gray), or normal following administration of 2 ng of the indicated MO(s). (C) MO-mediated knockdown of flt4, providing a sensitized background for the detection of vascular defects, was combined with nf1a, nf1b, and nf1a + nf1b ATG MO knockdown. Twenty-four to 85% of combined flt4/(nf1a, nf1b, nf1a + nf1b) MO-treated embryos display abnormal vascular shunts compared with 3–8% of individual flt4, nf1a, nf1b, or nf1a + nf1b MO-treated embryos. |
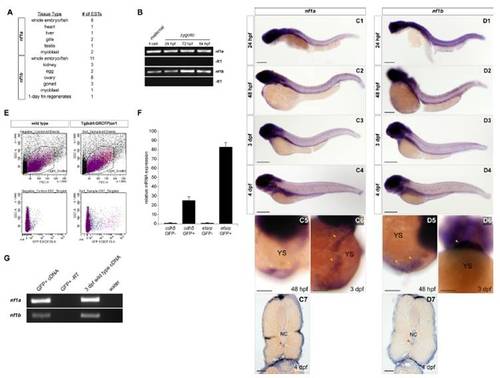
Zebrafish nf1a and nf1b are expressed during embryonic development. (A) Distribution of ESTs mapping to nf1a or nf1b in dbEST including tissue of origin. (B) RT-PCR analysis verifying maternal (one-cell) and zygotic (24, 72, and 84 hpf) expression of nf1a and nf1b. (C1–C6 and D1–D6) Whole-mount in situ hybridization of 24-hpf, 48-hpf, 3-dpf (all magnifications of insets in Fig. 2), and 4-dpf zebrafish embryos shows temporal and spatial expression patterns of nf1a and nf1b. (C5–C6 and D5–D6) Both nf1a and nf1b are expressed in cardiac tissue at 48 hpf and 3 dpf as seen in these anteroventral images. Notably, analysis of 14 μm (C7 and D7) cross-sections of whole-mount stained 4-dpf zebrafish embryos reveals strong nf1a and nf1b expression in the region of the dorsal vessel (arrows) directly below the notochord (NC). (E) Parameters used for sorting GFP-positive and GFP-negative cells from 3.5-dpf Tg(kdrl:GRCFP)zn1 zebrafish embryos. (F) Quantitative PCR analysis of the GFP-positive cell fraction reveals marked enrichment for endothelial-specific genes, including cdh5 and etsrp, relative to the GFP-negative fraction. (G) Reverse-transcription and PCR (RT-PCR) for nf1a and nf1b was performed using first-strand cDNA synthesized from endothelial cell RNA (GFP-positive cell fraction), confirming expression of both genes in vascular endothelium. (Scale bars: 25 μm.) |
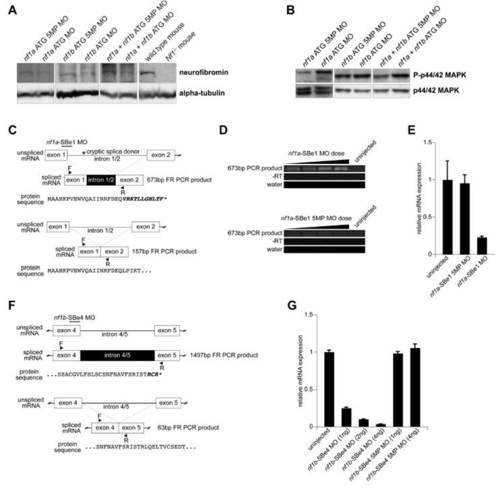
Transient knockdown of nf1a and nf1b is achieved by specific translational- and splice-blocking MOs. (A) Western blot analysis of nf1a ATG 5MP MO (2 ng)-, nf1a ATG MO (2 ng)-, nf1b ATG 5MP MO (10 ng)-, nf1b ATG MO (10 ng)-, nf1a + nf1b ATG 5MP MO (2 ng)-, and nf1a + nf1b ATG MO (2 ng)-treated 3.5-dpf zebrafish embryos. Administration of MOs specific for nf1a, nf1b, or both together leads to a marked decrease in neurofibromin at the protein level (wild-type and Nf1-/- mouse lysates are included as controls for antibody specificity). (B) Activation of effector pathways downstream of Ras, as assessed by increased P-p44/42 MAPK, are observed by Western blot analysis in 3.5-dpf nf1a (≈3 ng), nf1b (≈5 ng), and nf1a+nf1b (≈2 ng) ATG morphant zebrafish embryos when compared with dose-matched controls. (C) Schematic representation of site targeted by nf1a-SBe1MO.Administration of nf1a-SBe1MOleads to activation of a cryptic splice donor and the generation of an mRNA transcript harboring a premature stop codon. MO-mediated inclusion of intronic sequence in the mRNA transcript generates a 673-bp PCR product by RT-PCR using the depicted primer pair. (D) RT-PCR analysis from 1-, 2-, 3-, and 5-ng nf1a-SBe1 MO-treated samples using the depicted primer pair reveals a dose-dependent increase in the amount of the 673-bp PCR product that is absent in uninjected embryos. Injection of nf1a-SBe1 5MP MO does not lead to the generation of the 673-bp PCR product. (E) Quantitative PCR analysis of uninjected, nf1a-SBe1 MO-, and nf1a-SBe1 5MP MO-treated samples using the depicted primer pair (mean fold change ± SD). Administration of 3 ng of an nf1a-SBe1 MO leads to a 77% reduction in the wild-type nf1a transcript when compared with uninjected or 3-ng-injected nf1a-SBe1 5MP MO-treated samples. (F) Schematic representation of site targeted by an nf1b-SBe4 MO. Administration of nf1b-SBe4 MO leads to the inclusion of intron 4/5 in the nf1b mRNA transcript, which harbors a premature stop codon. MO-mediated inclusion of intronic sequence in the mRNA transcript generates a 1,497-bp PCR product by RT-PCR using the depicted primer pair, whereas the wild-type transcript generates a 63-bp PCR product. (G) Quantitative PCR analysis of uninjected, nf1b-SBe4 MO-, and nf1b-SBe4 5MP MO-treated samples using the depicted primer pair (mean fold change ± SD). Administration of 1, 2, or 4 ng of nf1b-SBe4 MO leads to a dose-dependent decrease in the wild-type nf1b mRNA transcript when compared with uninjected or nf1b-SBe4 5MP MO-treated samples. |
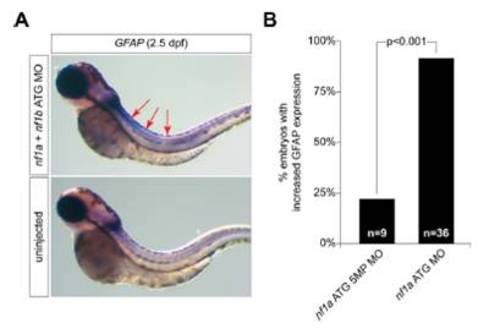
MO knockdown of the nf1a and nf1b results in neural defects. (A) At 2.5 dpf, nf1a/nf1b compound morphant zebrafish embryos display a marked increase in the intensity and domain of GFAP expression by whole-mount in situ hybridization when compared with stage-matched controls. (B) Some 92% of nf1a ATG morphant embryos were scored as having high levels of GFAP expression as compared with 22% of nf1a ATG 5MP MO (nf1a ATG 5-mispair control MO)-injected embryos by blinded qualitative analysis (P < 0.001). |
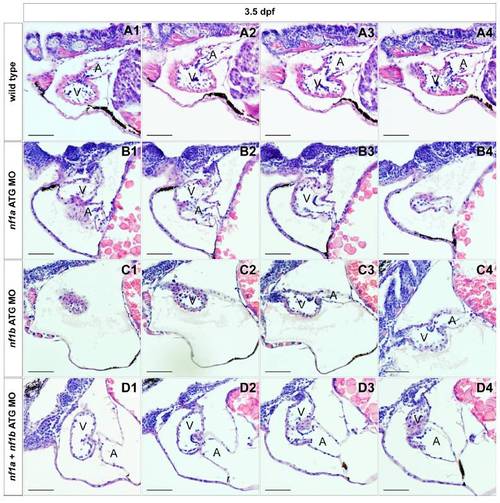
Histological analysis of MO knockdown cardiac valves. Serial transverse histological sections through the atrioventricular valves of wild-type (A1–A4) or ≈2 ng morphant nf1a ATG (B1–B4), nf1b ATG (C1–C4), and nf1a + nf1b ATG (D1–D4) 3.5-dpf zebrafish embryos reveal no readily apparent defects at the resolution afforded to us by histological analysis (A, atrium; V, ventricle). (Scale bars: 50 μm.) |
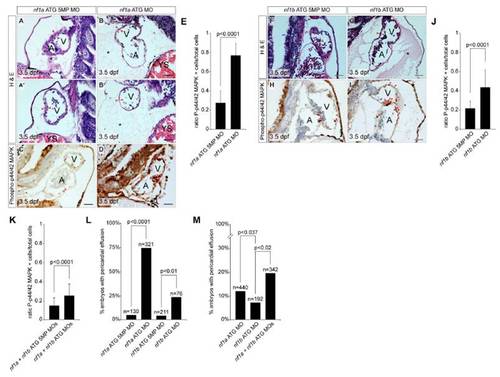
MO knockdown of nf1a or nf1b results in a thinning of the ventricular myocardium and increased phospho-Erk staining in cardiac tissue. (A, A′, B, B′, F, and G) Transverse histological sections through the heart of 3.5-dpf zebrafish embryos reveals a thinning of the ventricular myocardium (red arrows) of zebrafish treated with nf1a or nf1b ATG MOs when compared with the corresponding controls (A, atrium; V, ventricle; YS, yolk sac). Notably, a large pericardial effusion can be appreciated in nf1a and nf1b morphants (*). (C,D,H, and I) Immunohistochemichal analysis of transverse sections through 3.5-dpf zebrafish hearts reveals an up-regulation of phospho-p44/42 MAPK (phospho-Erk) in nf1a or nf1b morphants when compared with the appropriate 5MP controls. The ratio of phospho-Erk-positive cardiac cells to the total number of cardiac cells was quantified over multiple sections for nf1a MO(2 ng), nf1bMO(2 ng), and nf1a+nf1b MO (2 ng) groups (mean ratio phospho-p44/42 MAPK positive cardiac cells/total cardiac cells ± SD) (E, J, and K). (L) Quantification of percentage of embryos displaying a pericardial effusion phenotype at 3.5 dpf following injection of ≈2 ng of nf1a ATG 5MP MO, nf1a ATG MO, nf1b ATG 5MP MO, or nf1b ATG MO. Some 75% of nf1a ATG morphants displayed pericardial effusions as compared with5%of nf1a ATG 5-mispair (5MP) morphant controls (P<0.0001). Some 24% of nf1b ATG morphants displayed pericardial effusions as compared with 4% of nf1b ATG 5MP morphant controls (P < 0.01). (M) Quantification of percentage of embryos displaying a pericardial effusion phenotype at 3.5 dpf following injection of nf1a ATG MO, nf1b ATG MO, or nf1a + nf1b ATG MO. A suboptimal dose (1 ng) of nf1a ATG MO resulted in a 12% incidence of pericardial effusion, whereas a suboptimal dose (1 ng) of nf1b ATG MO resulted in a 7% incidence of pericardial effusion. Injection of 1 ng of a combination of nf1a + nf1b ATG MO, however, resulted in a 20% incidence of pericardial effusion. (Scale bars: 25 μm.) |
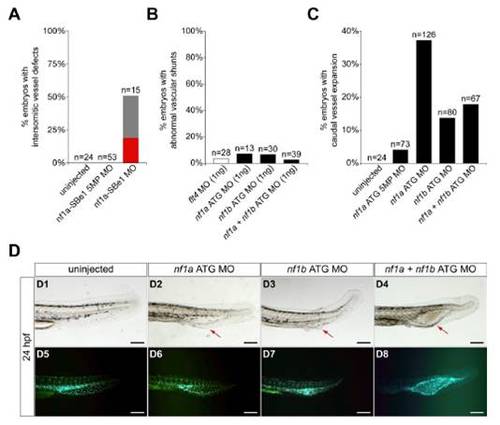
MO knockdown of nf1a, nf1b, or both together result in vascular defects at 24 at 48 hpf. (A) Quantification of vasculature at 24 hpf in uninjected and morphant Tg(fli:negfp)y7 (endothelial-specific nuclear GFP transgenic) zebrafish embryos. Uninjected, nf1a-SBe1 5MP (1 ng), and nf1a-SBe1 (1 ng) morphant embryos were qualitatively assessed for presence, absence (red), or an intermediate phenotype (gray) with regard to the developing trunk intersomitic vessels between somites 17–30 at 24 hpf. (B) Quantitation of vascular shunt phenotype seen with low (1 ng) doses of flt4, nf1a, nf1b, or nf1a + nf1b MOs. (C) Quantitation of cystic expansion phenotype observed in morphant Tg(fli:negfp)y7 embryos treated with 2 ng of the indicated MO(s). (D1–D8) Treatment of Tg(fli:negfp)y7 zebrafish embryos with an nf1a ATG MO, nf1b ATG MO, or nf1a + nf1b ATG MOs leads to a cystic expansion in the region of the caudal artery and vein (arrows, D2–D4) not present in uninjected embryos (D1). The expanded tissue was confirmed to be vascular by GFP expression (D6–D8). (Scale bars: 50 μm.) |