
- Title
-
Oncogenic NRAS Cooperates with p53 Loss to Generate Melanoma in Zebrafish
- Authors
- Dovey, M., White, R.M., and Zon, L.I.
- Source
- Full text @ Zebrafish

NRASQ61K causes hyperpigmentation in zebrafish. (A) Schematic representation of the transgene. (B) Animals injected with the NRAS construct develop nevi. (C) Hyperpigmentation in the NRAS1 and NRAS2 transgenic animals disrupts the normal pigment pattern. (D) Transgene copy number of NRAS1 and NRAS2 animals. Primers directed against the mitfa promoter were used. Wild-type fish were also used in this comparison and normalized to two copies per genome. (E) Relative transgene expression as measured by EGFP mRNA in both transgenic lines. (F) Low-grade melanocytic lesion observed in NRAS1 transgenic animals. Scale bar is 10μm. PHENOTYPE:
|

NRASQ61K cooperates with p53 loss in melanoma formation. (A) Tumor-bearing fish were identified by visual inspection and checked for fluorescence. The box around the tumor is shown in (B) under fluorescent light. (C, D) Tumor-free survival curves are shown. Three hundred and forty-two NRAS1 sibling and 167 NRAS2 sibling fish were inspected weekly for these studies. The location of tumors in NRAS1;p53-/- and NRAS2;p53-/- fish is shown in (E) and (F), respectively. (G, H) Loss of heterozygosity of the wild-type p53 allele is shown. One hundred percentage of NRAS1;p53+/- fish and 57% of NRAS2;p53+/- fish lose the wild-type copy of p53. PHENOTYPE:
|
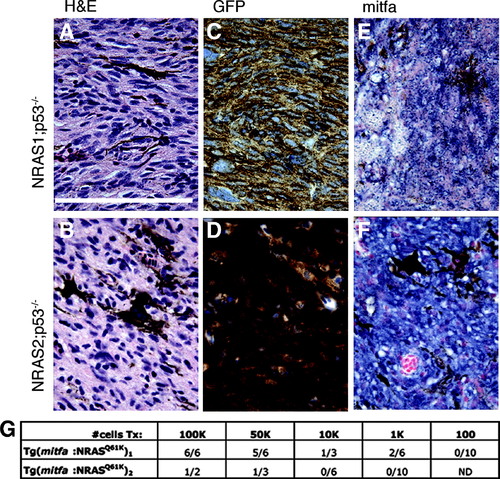
Histological examination of NRAS-driven tumors in zebrafish. (A, B) Hematoxylin and eosin (H&E) staining of melanomas reveals lesions with sporadic pigmentation and high levels of nuclear pleomorphism. (C, D) Standard immunohistochemistry against GFP revealed high levels of EGFP protein in these tumors, suggesting high and ubiquitous NRAS expression. (E, F) In situ hybridization to detect mitfa transcript indicates high levels of expression in these tumors. (G) Limiting dilution analysis of p53-null tumors from both transgenic lines transplanted intramuscularly into sublethally irradiated recipients. Scale bar = 10μm. (Color figure is available at liebertonline.com.) PHENOTYPE:
|