
- Title
-
Highly Divergent Gene Expression Programs Can Lead to Similar Chordate Larval Body Plans
- Authors
- Sobral, D., Tassy, O., and Lemaire, P.
- Source
- Full text @ Curr. Biol.
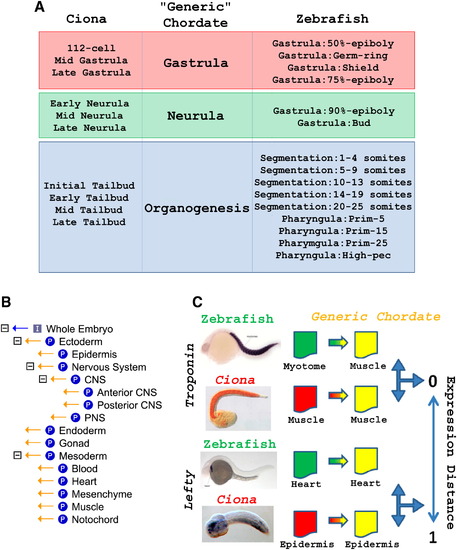
A Pipeline to Compare Spatiotemporal Gene Expression Profiles across Evolution (A) Correspondence of developmental stages between Ciona and zebrafish through an intermediate generic chordate. The stages for the generic chordate are the same as the bilaterian stages from [2]. (B) Generic chordate anatomical ontology. All relationships are “part-of” relationships. (C) General overview of the comparison process. Species-specific annotations were translated to the “General Chordate” ontology. Unified in situ hybridization (ISH) annotations of orthologous genes were then compared by using an expression distance (see Supplemental Experimental Procedures). |

The Expression of Ciona and Zebrafish Orthologs Broadly Differs (A) Box-plot distribution of the expression distances between ISHs of C. intestinalis genes and their D. rerio orthologs (orts) at gastrula stages (58 genes, 559 comparisons), neurula stages (79 genes, 242 comparisons), and organogenesis stages (524 genes, 18,800 comparisons). As a control, gene expression distance between C. intestinalis and D. rerio where orthologous pairs were replaced by randomly associated gene pairs is shown (rand). Differences between distributions of random and orthologous gene pairs are statistically significant (Wilcoxon rank-sum test, *p < 0.01 and **p < 10-16). (B) Examples of Ciona and fish orthologous genes with divergent expression. Zebrafish paralogs arfip2a and arfip2b [23] are expressed predominantly in the central nervous system (CNS). The single Ciona arfip gene is expressed in the endoderm. Similarly, zebrafish lefty1 and lefty2 [24] are expressed asymmetrically in heart precursors (some ISHs also show expression in the notochord and anterior CNS, as exemplified by the figure of lefty1), and Ciona lefty [10] is expressed in the epidermis. (C) Expression-based co-clustering at the organogenesis stage of C. intestinalis and D. rerio tissues (bootstrap over 524 orthologous groups). Numbers indicate percentage of confidence in the branching. For better reading, some of the numbers (all < 30) in the innermost nodes were omitted. |