
- Title
-
DeltaA mRNA and protein distribution in the zebrafish nervous system
- Authors
- Tallafuss, A., Trepman, A., and Eisen, J.S.
- Source
- Full text @ Dev. Dyn.
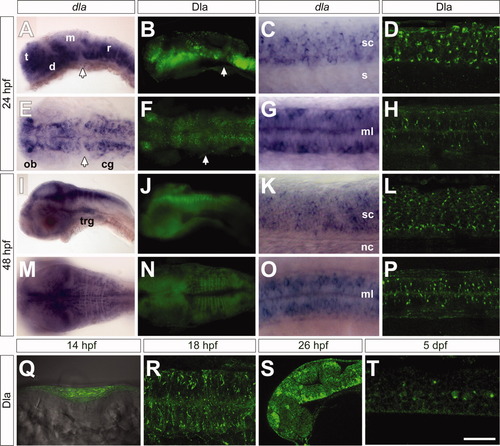
Comparison of dla mRNA and Dla protein expression patterns in the developing zebrafish embryo. A-D,I-L,S-T show lateral views, E-H,M-P,R show dorsal views. A,B: dla mRNA (A) and Dla protein (B) are expressed in a regionally restricted pattern in the developing brain at 24 hours postfertilization (hpf). C,D: Arrows mark the dla/Dla-free zone. Scattered dla mRNA (C) and Dla protein (D) distribution in the spinal cord. E: Defined dla mRNA expression in strings of cells in the presumptive brain. F: Dla protein appears more punctate than dla mRNA, but is expressed in the same brain regions. G,H: Spinal cord dla mRNA expression (G) compared with Dla protein labeling (H). I,J: At 48 hpf, dla mRNA (I) and Dla protein (J) distributions are more defined than at earlier stages. K,L: dla mRNA (K) and Dla protein (L) are widely expressed throughout the spinal cord. M: Dorsal view highlighting the highly ordered pattern of dla mRNA in the rhombomeres. N: Dla protein expression in the rhombomeres resembles dla mRNA distribution. O,P: dla mRNA (O) and Dla protein (P) labeling suggest a regionally conserved pattern in the spinal cord. Q: At 14 hpf, Dla protein is expressed throughout the neural plate, shown in a transverse view. R: Dla protein distribution at 18 hpf. S: Dla protein is localized in cell clusters in the developing brain at 26 hpf. T: At 5 dpf, Dla protein expression is maintained in some cells in the spinal cord. t, telencephalon; d, diencephalon; m, mesencephalon; r, rhombencephalon; sc, spinal cord; s, somite; ob, olfactory bulb; cg, cranial ganglia; trg, trigeminal ganglia; ml, midline; nc, notocord. Scale bars = 77 μm in A,B,E,F,I,J, 39 μm in C,D,G,H, 47 μm in M,N, 53 μm in K,L,O,P,Q, 33 μm in R, 65 μm in S, 25 μm in T. EXPRESSION / LABELING:
|

Dla antibody is specific to zebrafish Dla protein. A and B show confocal images of lateral views of two spinal cord segments at 24 hours postfertilization (hpf); anterior to the left, dorsal up. Dla protein is revealed in green, Islet 1/2 (Isl) protein in red. A: Wild-type embryo showing punctate Dla labeling scattered throughout the spinal cord. B: Dla labeling is abolished in homozygous carriers in the viral insertion line dlahi781Tg (dla-/-). Isl labeling shows an increased number of RB neurons in homozygous dlahi781Tg embryos. C,D: Polymerase chain reaction (PCR) on genomic DNA extracted from 6 single embryos (e1-e6) and one control wild-type embryo (ctr). Two different primer sets reveal carriers of the viral insertion in the dla locus versus noncarriers. C: In DNA from heterozygous (+/-) carriers and noncarriers (+/+), dla-specific primers amplify a specific product with the expected size of 450 bp. D: A specific product of 270 bp is amplified in heterozygous (+/-) and homozygous (-/-) carriers whereas no product appears in wild-types (+/+). Scale bar = 8 μm in A,B. |

Dla and Elavl protein expression domains are nearly mutually exclusive. A-D′ show lateral views and E-F″ transverse views of the spinal cord in 24 hours postfertilization (hpf; A,A′,C,C′,E-E″) and 48 hpf (B,B′,D,D′,F-F″) embryos, stained with Elavl (red) and Dla (green) antibodies. A′,B′,C′,D′,E″,F″ show only the green channel, E′,F′ only the red channel. The relative position of the images is marked in the cartoon (G). A-B′: In more lateral regions of the spinal cord, more cells express Elavl than express Dla. C-D′: In more medial regions of the spinal cord, there are less Elavl-positive neurons than Dla-positive cells. E-E″: Transverse section showing that Dla is localized closer to the midline compared with Elavl. F-F″: Transverse section showing a case in which an RB neuron expresses Dla but not Elavl (green asterisk). An RB neuron on the opposite side of the spinal cord expresses Elavl but not Dla (red asterisk). G: Cartoon showing the level of the sections shown in the photos; (l) more lateral section as seen in A-B′ and (m) more medial sections as seen in C-D′. sc, spinal cord; s, somite. Scale bars = 20 μm in A,A′,C,C′, 25 μm in B,B′,D,D′, 10 μm in E-F″. |
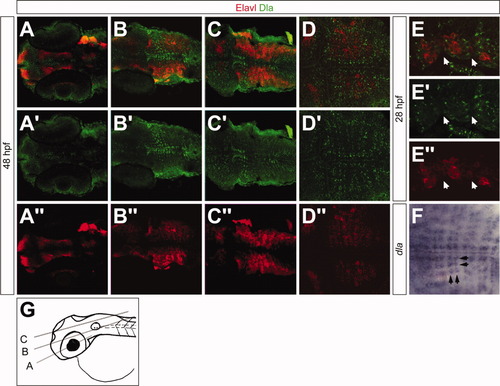
Dla is located in a regionally restricted pattern in the hindbrain. All images show dorsal views of 48 hours postfertilization (hpf; A-D″,F) and 28 hpf (E-E″) embryos. A-E″ are labeled with Elavl (red) and Dla (green) antibodies; F shows dla mRNA distribution. A′,B′,C′,D′,E′ show Dla staining, A″,B″,C″,D″,E″ show Elavl staining. A-A″: In the ventral part of the developing brain, Dla is detected in cell clusters near the midline. B-C″: Medial and dorsal Dla distribution is close to the midline and next to the rhombomere borders. D-D″: Dla labeling shows a regular pattern in the hindbrain, exclusive of Elavl staining. E-E″: Partial view of three rhombomeres at 28 hpf. Arrows mark rhombomere boundaries. Dla is located next to rhombomere borders whereas Elavl is expressed within the rhombomeres. F: dla mRNA expression resembles the Dla protein labeling shown in (E-E′). Black arrows mark dla-positive strings of cells in both anteroposterior axis and mediolateral axis. G: Cartoon showing the relative level of the images in A, B, and C. Scale bars = 53 μm in A-C″, 46 μm in D-D″,F, 25 μm in E-E″. |

Dla expression in the adult brain. Cross-sections of zebrafish adult brain labeled for Dla (red) and Elavl (green in A-C″), dla mRNA (D), or Dla (red) and glial fibrillary acidic protein (GFAP; green) in E-E″. B′,C′ show Dla and B″,C″ show Elavl labeling. A: Dla is widely expressed in 1-3 cell rows outlining the ventricle. Some Elavl-positive cells located near the ventricle do not express Dla. B-B″: Dla and Elavl protein labeling does not overlap. C-C″: Dla is expressed near the ventricle and in some scattered cells more distal to the ventricle (red arrows). Some Elavl-positive neurons differentiate close to the ventricle (green arrow). D: Consistent with Dla protein distribution, dla mRNA is expressed near the ventricle. E: Some GFAP-positive cells near the ventricle express Dla. E′ and E″ show the red or green channel respectively. F: Cartoon of an adult brain in a lateral view indicating the relative level of the cross section. v, ventricle. Scale bars = 125 μm in A, 50 μm in B-D, 7 μm in E-E″. EXPRESSION / LABELING:
|
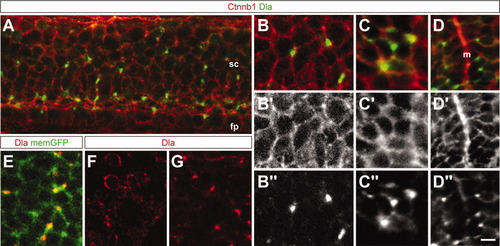
Dla protein subcellular localization on the cell cortex and/or membrane. Lateral (A-C) and transverse (D) views of 26 hours postfertilization (hpf) -old embryos labeled with Beta-catenin antibody (Ctnnb; red) and Dla antibody (green). A: Membrane localization of Dla, visible as dots or lines. B: Higher magnification reveals a putative cell to cell contact marked by Dla protein. (B′,B″) show the red and green channels respectively. C: Multiple Dla clusters suggest contact with several adjacent cells. C′,C″ show the red and green channels respectively. D: Transverse section showing the localization of Dla in the spinal cord relative to the midline. D′,D″ show the red and green channels respectively. E: Lateral view of 26-hpf-old embryo showing membrane green fluorescent protein (GFP; memGFP) [Tg(Bactin:HRAS-EGFP); green] and Dla antibody (red). F: Transverse section of adult brain labeled with Dla antibody showing distribution around entire cells. G: Lateral view of 26 hpf spinal cord labeled with Dla antibody showing punctate distribution. fp, floor plate; m, midline; sc, spinal cord. Scale bars = 5 μm in A,D, 3 μm in B,C, 4 μm in E-H″. |
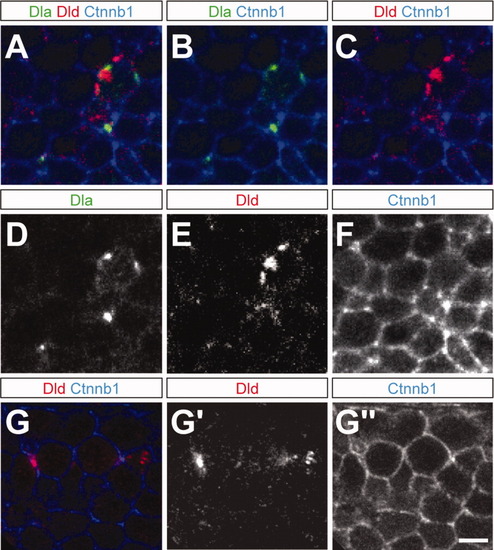
Dla and Dld protein subcellular localization. Lateral views of two different 26 hours postfertilization (hpf) embryos (A-F and G-G″). A: Triple staining of Dla antibody (green), Dld antibody (red), and Beta-catenin antibody (Ctnnb1, blue) showing that both Dla and Dld often localize to the cell cortex and/or membrane. B: Dla (green) colocalizes with Ctnnb1 (blue). C: In many cases, Dld (red) overlaps with Ctnnb1 (blue) staining. D-F show the green, red and blue channels, respectively. G: Double staining of Dld antibody (red) and Beta-catenin antibody (Ctnnb1, blue) showing that in the same region of the nervous system, Dld can be in the cell cortex and/or membrane (left side of panel) and also cytoplasmic (right side of panel). G′,G″ show the red and blue channels, respectively. Scale bar = 2.7 μm. EXPRESSION / LABELING:
|