
- Title
-
Actomyosin is the main driver of interkinetic nuclear migration in the retina
- Authors
- Norden, C., Young, S., Link, B.A., and Harris, W.A.
- Source
- Full text @ Cell
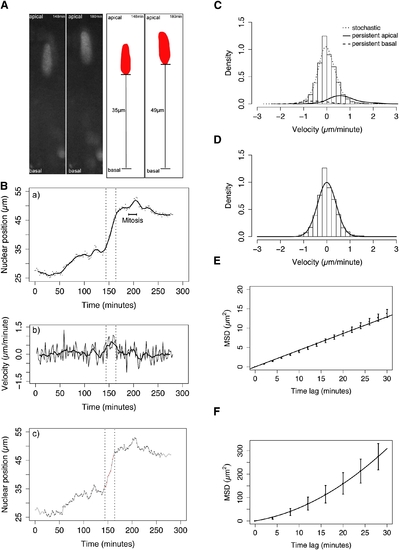
Statistical Analysis Reveals Stochastic and Directed Components of IKNM (A) Schematic illustrating measurement of nuclear position (distance from the basal lamina). Raw data and corresponding measurements (black lines) are shown for two example time points. (B) Trajectory (dots) and trend (moving average, line) of a single nucleus (shown in A) exhibiting distinct classes of motion are shown (a), corresponding instantaneous velocity series (thin line) with moving average (thick line) (b), and automated identification of transient periods of rapid persistent movement (red) in a background of stochastic movement (black) (c). (C) Velocity distribution of pooled nuclear movements in control embryos (curves show nonparametric density estimates scaled in proportion to the number of nuclear displacements representing the motion type, persistent motion curves are enlarged by a factor of ten). (D) Stochastic motion velocity distribution for pooled nuclear movement in control embryos with a normal fit. (E) Stochastic motion mean squared displacement (MSD) profile (error bars show 95% confidence interval) with linear fit for pooled control nuclei. (F) Premitotic persistent apical motion MSD profile (error bars show 95% confidence interval) with parabolic fit for pooled control nuclei. |

An Oriented Microtubule Cage Surrounds the Nuclei of Retinal Neuroepthelial Cells (A) MTs labeled with EMTB-GFP span the whole epithelium (a) and surround nuclei labeled by H2B RFP (b). A Three-dimensional reconstruction of MTs that envelope a nucleus is shown (c). (B) Ultrastructure of MTs in interphase close to the nuclear membrane. MTs are labeled by arrows. (C) EB3-GFP as a marker for polymerizing MT tips. Dots at the end of lines mark the last position of EB3-comets followed over time. (D) Centrin dots marked by Centrin2-GFP stay in apical positions throughout the movie. H2B-RFP marks nuclei. (E) Antibody staining of stable (acetylated) Tubulin (green) (a) versus α-tubulin (red) (b). A merge of (a) and (b) is shown in (c). DAPI (blue) counterstaining shows epithelial morphology (d). Arrows label dynamic spindle structures, arrowheads label stable spindle pole centrosomes, and asterisks label stable basal bodies. Scale bars represent 10 μm. |

Stochastic and Directed IKNM Movements Occur in Dynein/Dynactin-Compromised Neuroepithelial Cells (A) H2B-RFP marked nuclei of hsp70-PEST-DNp150-GFP-expressing cells migrate to the apical pole (arrows), exhibit successful mitosis and cytokinesis (arrowheads), and then migrate basally (arrows). (B) Raw nuclear trajectories showing nuclear migration during the 50 min preceding formation of a metaphase plate. (C) Nuclear positions 30 min before formation of a metaphase plate. Each dot represents one nucleus. Error bars show the mean and 95% confidence intervals. (D) Premitotic (-30 to 0 min before formation of metaphase plate) velocity estimates. Each dot represents velocity of one nucleus. Error bars show the mean and 95% confidence intervals. (E) Velocity distribution of nuclear movements in DNp150-expressing cells (curves show nonparametric density estimates scaled in proportion to the number of nuclear displacements representing the motion type; persistent motion curves are enlarged by a factor of ten). (F) Stochastic motion velocity distribution for nuclear movement in DNp150-expressing cells. (G) Stochastic motion MSD profile with linear fit (error bars show 95% confidence intervals) for nuclear movement in DNp150-expressing cells. Scale bars represent 10 μm. |
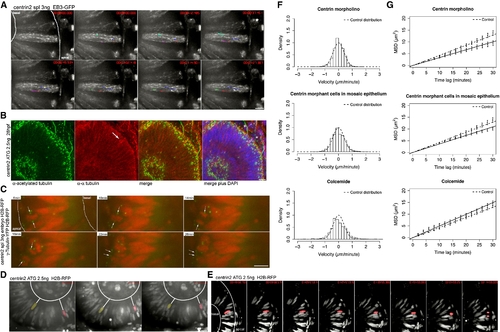
IKNM Is Relatively Normal in the Absence of Stable Microtubules (A) Polymerizing MT tips are stained by EB3. Centrin2 morphants show the same EB3-GFP kinetics as control embryos in Figure 1B. Dots at the end of lines mark the last position of EB3 comets followed. (B) Antibody staining of α-tubulin (red) and acetylated tubulin (green) as in Figure 2C. Acetylated tubulin stains basal bodies (asterisks), but no stabilized MTs are observed spanning the epithelium (a). α-tubulin antibodies label mitotic spindles (arrow) and residual dynamic tubulin (b). A merge of (a) and (b) is shown in (c). Asterisks label stable basal bodies that are only stained by acetylated and not α-tubulin. DAPI (blue) counterstaining shows epithelial morphology (d). (C) Images of Movie S6. Centrin2 morphants perform mitosis and cytokinesis at the apical membrane of the epithelium, after mitosis nuclei marked by H2B-RFP move away from this side. Centrosomes marked by γ-tubulin first serve as spindle pole bodies and then move back to apical side of epithelium (arrows). (D) Images of Movies S7 and S8. Nuclei labeled by H2B-RFP move in apical and basal direction in centrin-2 morphants, indicated by white lines between false color red and yellow nuclei and the basal membrane of the epithelium. (E) Nuclei still undergo rapid apical migration before mitosis as seen in the control cells. (F) Stochastic motion velocity distributions for centrin morphant embryos, mosaic centrin morphant cells in control epithelium, and Colcemide-treated embryos. (G) Stochastic motion MSD profile with linear fit (error bars show 95% confidence intervals) for centrin morphant embryos, mosaic centrin morphant cells in control epithelium, and Colcemide-treated embryos. Scale bars represent 10 μm. PHENOTYPE:
|

IKNM Occurs in the Complete Absence of Microtubules (A) Images of Movie S10. Polymerizing MTs are stained by EB3. Colcemide-treated (20 μM) embryos show reduced MT polymerization starting 120 min after drug addition. Shortly after drug addition, spindles are still formed and cells divide (arrow). Colcemide treatments of 120 min and longer arrest cells in metaphase for the rest of the observation time (arrowheads). (B) Antibody staining of α-tubulin (red) and acetylated tubulin (green) like in Figure 2C in embryos treated with 20 μM Colcemide. Acetylated tubulin antibodies label stable basal bodies (asterisks), but no other stable structures are seen (a). α-tubulin antibodies label cytoplasmic tubulin (b). A merge of (a) and (b) is shown in (c). Asterisks label stable basal bodies that are only stained by acetylated not by α-tubulin. (C) Images of Movie S11. H2B-RFP-labeled nuclei are able to move in apical and basal direction in epithelia treated with 20 μM Colcemide, indicated by white lines between false colored red and yellow nuclei and the basal membrane of the epithelium. (D) Images of Movie S12. Nuclei still undergo rapid apical migration before forming a metaphase plate as seen in the control cells. Scale bars represent 10 μm. |

Actomyosin Is Active Basal to Apically Migrating Nuclei in the Retinal Neuroepithelium (A) Confocal image three-dimensional reconstruction of GFP-Utr-CH labeling filamentous actin and H2B-RFP labeling nuclei. GFP-Utr-CH is seen at adhesion sites and plasma membranes. Arrows label prominent actin accumulation basal to nuclei. (B) Images from Movie S14. Nuclei are labeled by H2B-RFP. After photoactivation of PaGFP-Utr-CH, it distributes more notably to the basal side of the plasma membrane beneath nucleus (arrowheads). Stable accumulations are seen basally of nucleus (arrow). (C) Antibody staining with Phospho-Myosin Light Chain 2 antibodies for activated MyosinII (green) and plus DAPI (blue). Arrows mark basal accumulations of activated MyosinII. (D) Images from Movie S15. Constitutively activated Myosin Light Chain is labeled by MRLC2T18DS19D-GFP. Nuclei are labeled by H2B-RFP. Pink dot labels nucleus that migrates apically. Arrows label activated Myosin Light Chain dots that move apically basal of the nucleus. Scale bars represent 10 μm. |

IKNM Movements Are Inhibited when MyosinII Activity Is Blocked, but the Effect Can be Rescued by MRLC2T18DS19D (A) Images from Movies S13–S15 at 3 hr intervals. Pseudocolored nuclei in WT (upper panel) travel further than nuclei treated with 100 μM Blebbistatin or 25 mM BDM (lower panels). Arrows mark a mitotic but not separated nucleus in BDM treatment. (B) Stochastic motion velocity distributions for Blebbistatin- and BDM-treated embryos, and centrin morphants and DNp150-expressing cells treated with BDM. (C) Stochastic motion MSD profiles (error bars show 95% confidence intervals) with linear fit for Blebbistatin- and BDM-treated embryos, and centrin morphant and DNp150-expressing cells treated with BDM. (D) Stochastic motion velocity distributions for BDM-treated embryos injected with MRLC2T18DS19D-GFP or wild-type MRLC2-GFP, respectively. (E) Stochastic motion MSD profiles (error bars show 95% confidence intervals) with linear fit for BDM-treated embryos injected with MRLC2T18DS19D-GFP or MRLC2-GFP, respectively. Only the activated MRLC partially rescues the effect of BDM treatment. Scale bars represent 10 μm. PHENOTYPE:
|

A) Alignment of Dnct1 from zebrafish (top sequence) versus human (bottom sequence) for the region of the dominant negative protein. Alignments were generated in MegAlign (DNAstar, V6) using the Lipman-Pearson protein algorithm with 0 gap penalty. Overall sequence identity between the proteins is 65%. within specific domains, however, identity is higher: Microtubule binding domain/Cap-Gly region, 86% identity (green); dynein motor binding domain, 84% identity (yellow); dynein intermediate chain binding domain, 80% identity (blue). B) The dominant negative p150-GFP labels spindle structures at mitosis. |
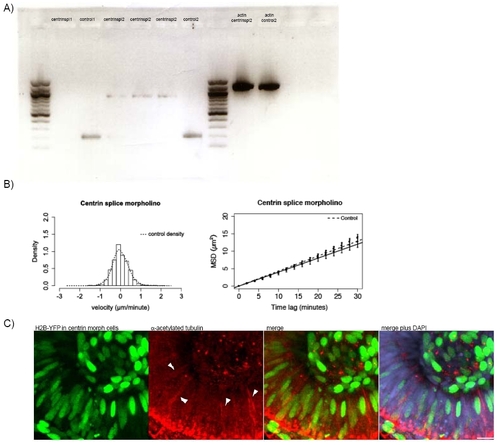
A) RNA was extracted from embryos using a Quiagen RNeasy Minikit and transcribed into DNA using the Quiagen One Step RT-PCR-kit. B) Stochastic motion velocity distributions for centrin splice morphants and stochastic motion MSD profiles with linear fit for centrin splice morphants C) Embryos were co-injected with H2B-YFP-RNA and 2.5ng Centrin2 translational morpholino at the 64 cell stage. Only cells expressing H2B-YFP are centrin morphants. Antibody staining for stable (acetylated) tubulin (red) was carried out to observe if cells that do not carry the morpholino still form stable microtubules that span the whole length of the cell. DAPI (blue) counterstaining shows cells not expressing H2B-YFP. |

A) Images from Movie 10. GFP-Utr-CH disappears from the basal process of cells just before mitosis and cytokinesis (arrows moving up). It quickly reappears after cell division (arrows moving down). B) Non-activatable Myosin is labelled by MRLC2T18AS19A-GFP. Nuclei are labelled by H2B-RFP. C) Co-labelling of MRLC2T18DS19D-GFP for constitutively activated Myosin and RFP-Utr-CH for filamentous actin shows that localizations overlap (merge). Arrows show basal accumulation of activated myosin with actin accumulations. |

Photoactivation experiments of PaGFP-Utr-CH in control epithelia; epithelia treated with 25mM BDM for 4h and epithelia treated with 25mM BDM for 6h are compared. The GFP marker gets more diffuse the longer BDM is added and no stable accumulations of filamentous actin are observed any more. |

Unillustrated author statements PHENOTYPE:
|
Reprinted from Cell, 138(6), Norden, C., Young, S., Link, B.A., and Harris, W.A., Actomyosin is the main driver of interkinetic nuclear migration in the retina, 1195-1208, Copyright (2009) with permission from Elsevier. Full text @ Cell