
- Title
-
Cardiac hypertrophy involves both myocyte hypertrophy and hyperplasia in anemic zebrafish
- Authors
- Sun, X., Hoage, T., Bai, P., Ding, Y., Chen, Z., Zhang, R., Huang, W., Jahangir, A., Paw, B., Li, Y.G., and Xu, X.
- Source
- Full text @ PLoS One
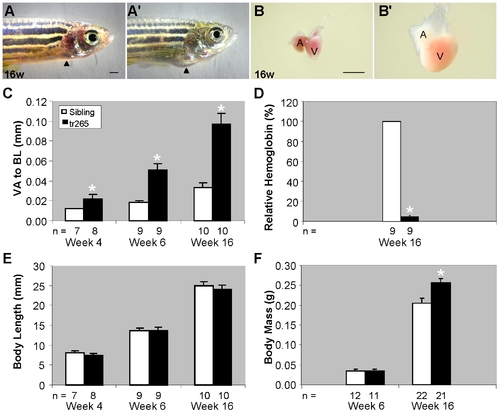
Chronic anemia induces cardiomegaly in tr265/tr265 zebrafish. (A,A′) Pictures of the cardiomegaly in a week-16 (A′) tr265/tr265 and normal appearance of (A) a sibling; arrowhead points to the heart region. (B,B′) Dissected hearts of (B) the sibling and (B′) tr265/tr265; A, atrium, V, ventricle; bar = 1 mm. (C) Ventricle area to fish length (VA/BL) index used as a measurement of the cardiomegaly for week-4, -6, and -16 hearts. (D) Percent relative hemoglobin concentration at week 16. (E) Body length (in mm) at week 6 and 16. (F) Body mass (in grams) at week 6 and 16. (C–F) mean±SEM; * = P<0.05. n = number of fish examined. PHENOTYPE:
|
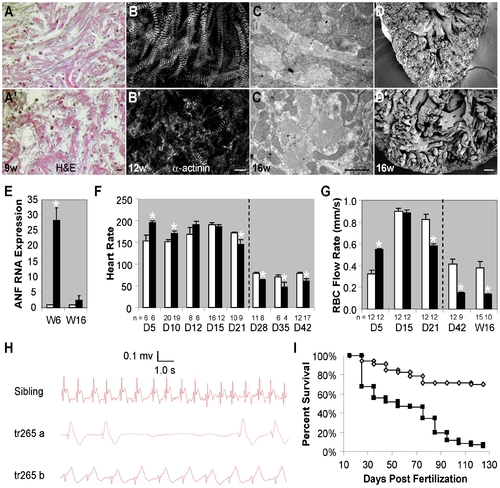
Progressive cardiomyopathy is associated with tr265/tr265. (A,A′) H&E-staining revealing muscular disarray in week-9 (A′) tr265/tr265 ventricles, compared to the control (A); bar = 50 μm. (B,B′) α-actinin antibody staining of week-12 ventricle sections (B, sibling, B′, tr265/tr265) (bar = 10 μm) and (C,C′) transmission electron microscopy of week-16 (C) sibling and (C′) tr265/tr265 ventricle sections (bar = 1 μm) showing abnormal sarcomeres; * = sarcomeres in C,C′. (D,D′) Disorganized papillary muscles in week-16 (D′) tr265/tr265 compared to (D) sibling viewed using scanning electron microscopy; bar = 400 μm. (E) Increased atrial natriuretic factor (ANF), a fetal gene and cardiac hypertrophy marker, in week-6 and not week-16 tr265/tr265 hearts, measured with real time PCR. (F) Changes in heart rate from day 5 to 42. (G) Red blood cell flow rate at day 4, week 6, and week 16, corresponding to the results in G. Anesthesia was used to keep the fish still for timepoints after the dashed line. (H) Electrocardiograms of a sibling and two tr265/tr265 fish at week 20. (I) Survival curves (Kaplan-Meier representation) of the sibling (◊) and tr265/tr265 (■). (F–H) mean±SEM; * = P<0.05. n = number of fish examined. |
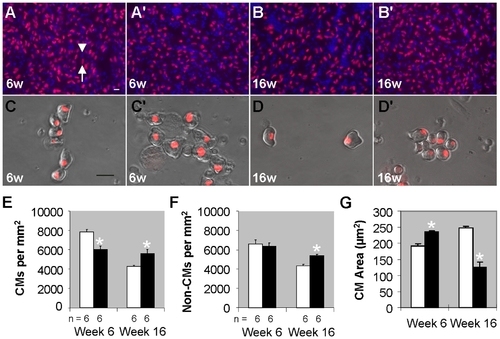
Myocyte hypertrophy contributes to early stages of cardiac remodeling in tr265/tr265. (A–B′) Images of cardiomyocytes (red+ blue+; arrow) and non-cardiomyocytes (blue+ only; arrowhead) in week-6 and -16 (A, B) sibling and (A′,B′) tr265/tr265 ventricle sections from fish outcrossed to Tg(cmlc2:nuDsRed) fish, whose terminally-differentiated cardiomyocyte nuclei are fluorescent red; blue is Hoechst-labeling of nuclei; bar = 10 μm. (C–D′) Dissociated ventricular cardiomyocytes cultured and imaged to reveal cell size and shape from week-6 and-16 (C,D) sibling and (C′,D′) tr265/tr265 fish; bar = 20 μm. (E) Cardiomyocyte and (F) non-cardiomyocyte density (cells/mm2) from fish represented in A–B′. (G) Surface area (in μm2) of cultured cardiomyocytes, like the ones in C–D′. (E–G) mean±SEM; * = P<0.05. n = number of fish examined. EXPRESSION / LABELING:
PHENOTYPE:
|
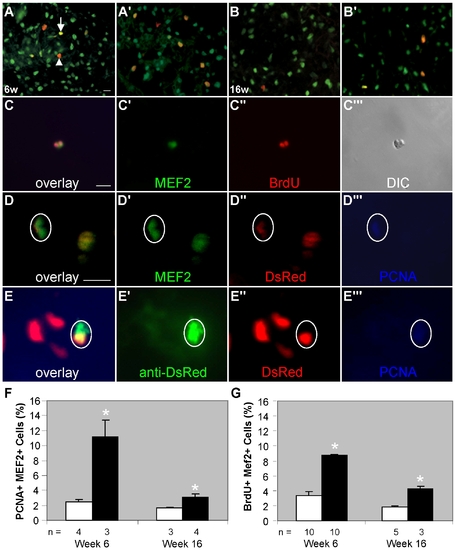
Myocyte hyperplasia contributes to all stages of cardiac remodeling in tr265/tr265. (A–B′) Overlay of proliferating cell nuclear antigen (PCNA) antibody (red) with MEF2 antibody (green) in 10-μm sections of week-6 and -16 (A,B) sibling and (A′,B′) tr265/tr265 ventricles to show proliferating cardiomyocyte-lineage cells (yellow overlay; arrow) and proliferation of other cells (red overlay; arrowhead); bar = 50 μm. (C–C″′) Example of recently divided cells of the cardiomyocyte lineage (green) detected with BrdU antibody (red); bar = 10 μm. (D–D″′) Example of a proliferating mature cardiomyocyte (encircled) from a tr265/tr265 Tg(cmlc2:nuDsRed) mutant fish expressing DsRed, MEF2, and PCNA in its nucleus; bar = 10 μm. (E–E″′) Proliferating cardiomyocytes (encircled) derived from a cardiac progenitor cell in tr265/tr265 Tg(cmlc2:nuDsRed) transgenic fish containing unfolded DsRed in its cytoplasm and DsRed and PCNA in its nucleus. (F,G) Ratio of (F) PCNA+ MEF2+ cells over total MEF2+ cells or (G) BrdU+ MEF2+ cells over total MEF2+ cells in ventricles of week-6 and-16 sibling and tr265/tr265 fish, given as a percent; mean±SEM; * = P<0.05; n = number of fish examined. PHENOTYPE:
|
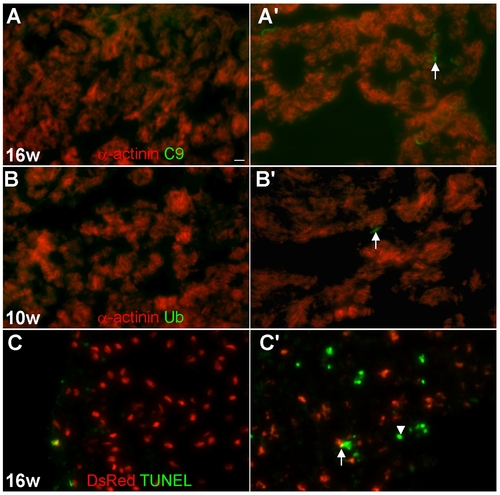
Oncosis is the main form of cardiomyocyte death in tr265/tr265. (A–A′) Increased number of cardiomyocytes undergoing oncosis in 10-μm ventricle sections of (A′) tr265/tr265 compared to (A) the sibling detected by a C9 antibody (green) and α-actinin antibody (red; cardiomyocytes); arrow points to a C9-positive cardiomyocyte; bar = 10 μm. (B,B′) Few, but more, autophagic cardiomyocytes seen in (B′) tr265/tr265 vs. (B) the sibling with a ubiquitin antibody (green) and α-actinin antibody (red; cardiomyocytes); arrow points to an ubiquitin-positive cardiomyocyte. (C,C′) Increased number of apoptotic non-cardiomyocytes (green overlay; arrowhead) in (C′) tr265/tr265, compared to (C) the sibling detected with TUNEL (green); cardiomyocytes (nuclear DsRed); arrowheads point to the rare apoptosing cardiomyocytes (yellow overlay). PHENOTYPE:
|
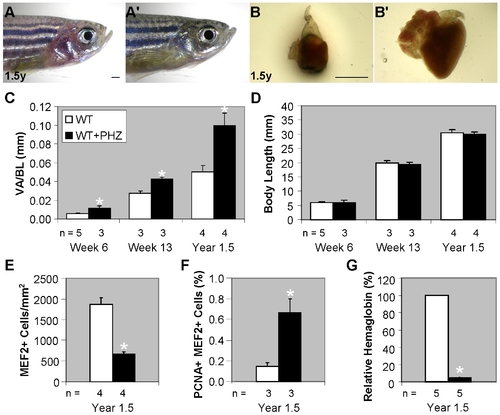
Phenylhydrazine hydrochloride treatment of wild-type zebrafish recapitulates the cardiac remodeling process of tr265/tr265. (A–A′) PHZ treatment results in anemia in zebrafish, as evidenced by (A′) the paleness in the gill region, compared to (A) the control; bar = 1 mm. (B–B′) (B′) Anemia-induced cardiomegaly seen after three weeks of treatment versus (B) the control; bar = 1 mm. (C) Ventricle area to body length index of week-6, week-13, and year-1.5 control and PHZ-treated fish. (D) Body length (in mm) of the control vs. PHZ-treated fish. (E) MEF2+ cell density (cells/mm2) of year-1.5 control and treated fish. (F) Percent of proliferating MEF2+ cells in year-1.5 control and treated fish. (G) Percent relative hemoglobin concentration in the year-1.5 control and treated fish. (C–G) mean±SEM; * = P<0.05; n = number of fish examined. |
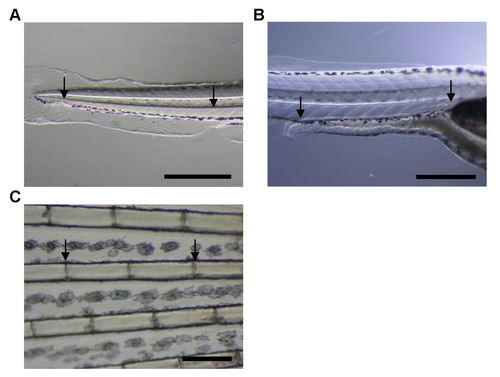
Starting and ending locations for the red blood cell flow rate. Red blood cells were timed between the arrows shown in the pictures of a (A) day-5 post-fertilization zebrafish at day 5, (B) day-15 post-fertilization zebrafish at day 15 and 21, and (C) day 42 zebrafish caudal fin (fourth main ray from bottom) at day 42 and week 16; bar = 0.5 mm. |
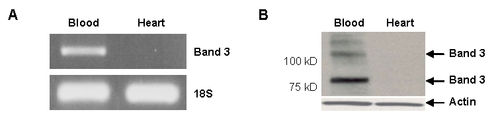
Band 3 is not expressed in the zebrafish heart. (A,B) (A) RT-PCR and (B) western of Band 3 expression in adult zebrafish blood and lack thereof in the heart. |

Unillustrated author statements PHENOTYPE:
|