
- Title
-
Mosaic hoxb4a neuronal pleiotropism in zebrafish caudal hindbrain
- Authors
- Ma, L.H., Punnamoottil, B., Rinkwitz, S., and Baker, R.
- Source
- Full text @ PLoS One

Overview of hoxb4a expression and hindbrain neuronal subgroups from 0.5 to 30 dpf. (A–H) Composite dorsal views of hoxb4a-YFP (green) and retrogradely labeled reticulospinal neurons (red) from confocal stacks of 133 μm (0.5 dpf), 116 μm (1 dpf), 116 μm (1.5 dpf), 176 μm (2 dpf), 148 μm (4 dpf), 172 μm (10 dpf), 190 μm (20 dpf) and 180 μm (30 dpf). Reticulospinal neurons in D, H are named according to Kimmel (1982) [32]. Bright-field images are overlaid in A–D. Arrow, bracket and asterisks in E–H mark hoxb4a activity observed in r4, r6 and cerebellum, respectively. Insets in E–H show the larvae at the corresponding stage with total body length indicated. (I–J) Schematics summarizing hoxb4a activity (green) with the location of r7–8 neuronal subgroups corresponding to rhombomeres and myotomes in dorsal (I) and coronal views (J). Abbreviations: Ant, anterior. Ce, cerebellum. HB, hindbrain. IO, inferior olive. M (in B–D, H), Mauthner cell. M (in I), myotome. MB, midbrain. mlf, medial longitudinal fasciculus. NE, neural epithelial cell. llf, lateral longitudinal fasciculus. r, rhombomere. Scale bars = 50 μm. |
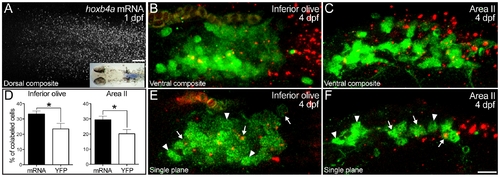
Mosaic hoxb4a expression within hindbrain nuclei. (A) Hoxb4a expression in hindbrain r7–8 of a 1 dpf larva detected by fluorescent and colormetric procedures (inset). (B–C) Ventral composites of the precerebellar inferior olive (B) and Area II (C) nuclei (20 μm confocal stacks) retrogradely labeled from the cerebellum at 4 dpf (green), with hoxb4a mRNA (red) detected by fluorescent in situ hybridization. (D) Graphs showing only a subset of inferior olive and Area II neurons expressed hoxb4a mRNA (solid bar) and hoxb4a-YFP (open bar). P-values from Student t-test were 0.04 for both the inferior olive and Area II. (E–F) Single plane images showing mosaic hoxb4a expression in the olive (E) and Area II (F). Arrows and arrowheads point to cells that did and did not expression hoxb4a. Scale bar = 20 μm (A) and 10 μm (B–C and E–F). |

Hoxb4a activity in reticulospinal neurons. (A–J) Composite dorsal views showing retrogradely labeled reticulospinal neurons (A–E) and corresponding hoxb4a-YFP expression (F–J) from 116 μm (1 dpf), 176 μm (2 dpf), 148 μm (4 dpf), 190 μm (20 dpf) and 180 μµm (30 dpf) confocal stacks. (K–T) High magnification single plane images showing T-interneurons and hoxb4a expressing cells in r8. Arrowheads point to co-labeled cells. Abbreviations: Ant, anterior. Ca, Caudal Rhombencephalon. M, Mauthner cell. M1–3, myotome pair 1–3. Mi2, Middle Rhombencephalon level 2. Mi3, Middle Rhombencephalon level 3. Scale bars = 50 μm (A–J) and 5 μm (K–T). |
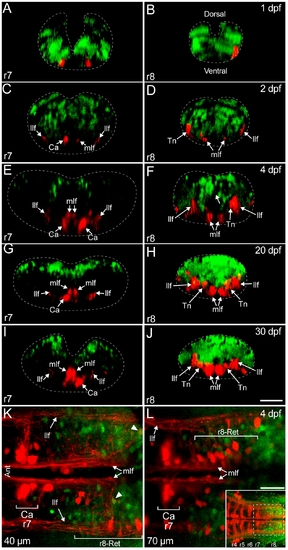
Hoxb4a activity along the dorsoventral axis in r7–8. (A–J) Optically reconstructed transverse sections at the level of r7 (A, C, E, G, I) and r8 (B, D, F, H, J) in 1, 2, 4, 20 and 30 dpf transgenic zebrafish. Dashed lines outline the hindbrain boundaries in the sections with anterior-posterior position indicated in Fig. 4 (A–E). (K–L) Single plane images acquired from the ventral side of an isolated brain at 40 μm (K) and 70 μm (L) depth showing hoxb4a-YFP expression and reticulospinal neurons from r7 to rostral r8 at 4 dpf. Arrowheads point to r8-reticular neurons that expressed hoxb4a-YFP. Inset in L is an overview of the caudal reticular scaffold and hoxb4a cells imaged from the ventral side with the box indicating the viewing field in K–L. Abbreviations: Ant, anterior. Ca, Ca neuron. Llf, lateral-longitudinal fasciculus. Mlf, medial-longitudinal fasciculus. r8-Ret, r8-reticular neurons. Scale bars = 50 μm (A–J) and 10 μm (K–L). |

Hoxb4a activity in rostrally projecting neurons. (A–B) Composite dorsal views from 110 μm (A) and 125 μm (B) confocal stacks showing neurons retrogradely labeled from the midbrain (A) and r4 (B) at 4 dpf. Insets show the corresponding hoxb4a-YFP expression. (C–D) Single plane high magnification images showing hoxb4a-YFP expression and retrogradely labeled neurons. Arrowheads point to co-labeled cells. Anterior is to the left. Scale bars = 50 μm (A–B) and 10 μm (C–D). |

Hoxb4a activity in precerebellar neurons. (A–B, E–F) Composite dorsal views from 110 μm (A), 125 μm (B), 60 μm (E) and 75 μm (F) confocal stacks showing neurons retrogradely labeled from the cerebellum at 4 dpf (A–B) as well as the inferior olive at 30 dpf (E) and 60 dpf (F). Insets in A–B show the corresponding hoxb4a-YFP expression at 4 dpf. (C–D, G–H) Single plane high magnification images showing hoxb4a-YFP expression and retrogradely labeled neurons. Arrowheads point to co-labeled cells. Anterior is to the left. Scale bars = 50 μm (A–B, E–F) and 10 μm (C–D, G–H). |
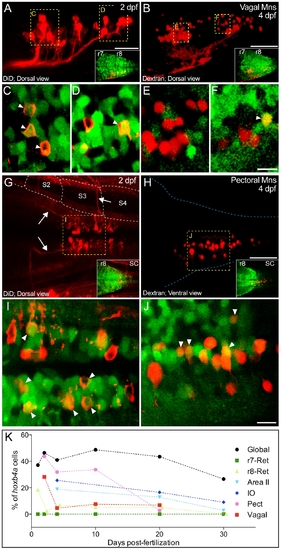
Hoxb4a activity in vagal and r8-pectoral motoneurons. (A–B, G–H) Composite dorsal views from 125 μm (A), 180 μm (B), 130 μm (G) and 70 μm (H) confocal stacks showing retrogradely labeled vagal (A–B) and pectoral (G–H) motoneurons at 2 and 4 dpf. Insets show the corresponding hoxb4a expression. (C–F, I–J) Single plane high magnification images showing hoxb4a-YFP expression and retrogradely labeled motoneurons. Arrows point to co-labeled cells. Anterior is to the left. Scale bars = 50 μm (A–B, G–H) and 10 μm (C–F, I–J). (K) Percentage of hoxb4a cells in each identified neuronal subgroup versus time from 2–30 dpf. |

Clonal analysis by single cell injection. (A–B, E–F, I) Composite dorsal views from 165 μm (A–B), 170 μm (E–F) and 130 μm (I) confocal stacks showing progenitors from a single cell injected during the gastrula period (red) and hoxb4a-YFP (green). (C–D, G–H, J–K) Single plane high magnification images showing the progenitor cells and hoxb4a-YFP expression. Arrowheads point to the co-labeled cells. Arrows in F mark the processes (dendrite/axon) extending from the neurons at 2 dpf. Anterior is to the left. Dashed lines marked the midline. Scale bars = 10 μm. |

Live imaging and immunohistochemically detected hoxb4a activity in the midbrain, cerebellum, hindbrain and spinal cord. Composite dorsal (A) and side (C) views of hoxb4a expression in a live 5 dpf transgenic zebrafish from 210 μm and 150 μm confocal stacks, respectively. (B, D) Dorsal (B) and side (D) views of hoxb4a-YFP using immunohistochemistry (anti-YFP) in a fixed 6 dpf fish. Horizontal (E, G) and coronal sections (F, H) with section planes indicated in (B, D). Target sites for retrograde labeling are marked by 1 (spinal cord), 2 (Xth nerve), 3 (pectoral fin), 4 (cerebellum), 5 (midbrain) and 6 (r4). Abbreviations: AII, Area II; Ce, cerebellum; D, diencephalon; HB, hindbrain; llf, lateral longitudinal fascicle; IO, inferior olive; MB, midbrain; mlf, medial longitudinal fascicle; Oc N, occipital nerve; OV, otic vesicle; Pon N, pontine nucleus; SC, spinal cord; Vagal N, vagal nerve. B, D and E–H are cropped high magnification illustrations of Figs. 5K, 5J, 5C, 5T, 5D and 4B, respectively, (from [25]). |

Mosaic hoxb4a activity. (A–D) Single plane images showing hoxb4a (green) and Hoechst nuclear counterstain (red) acquired from the dorsal 60 μm of r7–8 at 2 (A), 4 (B), 10 (C) and 20 (D) dpf in transgenic zebrafish. Dashed lines mark the ventricular surface. (E) Graph showing the percentage change of hoxb4a cells from 1 to 30 dpf in dorsal r7–8. Scale bars = 10 μm. |