
- Title
-
Distinct phases of cardiomyocyte differentiation regulate growth of the zebrafish heart
- Authors
- de Pater, E., Clijsters, L., Marques, S.R., Lin, Y.F., Garavito-Aguilar, Z.V., Yelon, D., and Bakkers, J.
- Source
- Full text @ Development
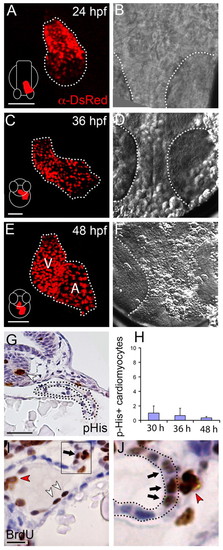
Insufficient proliferation in the myocardium to account for the increase of cardiomyocyte number in the zebrafish heart. (A,C,E) To quantify cardiomyocyte numbers at various stages of development, Tg(cmlc2:dsred2-nuc) embryos of 24, 36 and 48 hpf were fixed, stained using an α-DsRed antibody and imaged by confocal microscopy. Maximum projections of the DsRed signal is shown in these panels. The dotted line outlines the heart tube; the arterial pole (outflow) is to the top and the venous pole (inflow) to the bottom. Schematics of embryos at the various developmental stages are shown in the left bottom of panels A, C and E; white outlines the embryo and red represents the forming heart tube at each stage. The 24 hpf embryo is shown in dorsal view, the 36 and 48 hpf embryos in anterior view. V, ventricle; A, atrium. (B,D,F) Brightfield images of the embryos shown in A, C and E; dotted lines outline the eyes. (G) Phospho-His staining (brown) on transverse sections through the heart at 36 hpf. The dotted line indicates the myocardium; white arrowhead indicates a phospho-His-positive cell in the neural tube. (H) The total number of phospho-His-positive myocardial cells/embryo at 30 (n=3), 36 (n=3) and 48 hpf (n=6). Bars represent mean±s.e.m. (I,J) BrdU labeling from 24-48 hpf. White arrowheads indicate BrdU-positive (brown) endocardial cells; red arrowhead indicates a BrdU-positive blood cell; black arrow indicates BrdU-positive myocardial cells. (J) Enlargement of the black box in I indicating BrdU-positive cells in the arterial pole of the 48 hpf zebrafish heart; dotted lines outline the myocardium. Scale bars: 50 μm in A,C,E; 25 μm in G; 10 μm in I. |

Delayed cardiomyocyte differentiation first arises at the venous pole and later also contributes cells to the arterial pole. (A-I) Developmental timing assay images: reconstruction of confocal z-stacks of eGFP (A,D,G), DsRed (B,E,H), and overlay (C,F,I) from Tg(cmlc2:eGFP)/Tg(cmlc2:dsred2-nuc) embryos. The arterial pole is to the top left; dotted lines outline the eGFP positive heart tubes. Scale bars: 50 μm. (A-C) At 24 hpf, eGFP fluorescence was visible in the entire heart tube. At this time point, no DsRed fluorescence was observed. (D-F) At 36 hpf, the eGFP fluorescence was visible in the entire heart tube. DsRed fluorescence was detected only in the ventricle and at the inner curvature of the atrium. Arrows indicate the regions in the heart tube that are negative for the DsRed signal. (G-I) At 48 hpf, both GFP and DsRed fluorescence were observed in the heart tube. The DsRed signal remained absent from the poles (arrows), which were positive for eGFP. (J,K) Single confocal scan from Tg(cmlc2:GFP)/Tg(cmlc2:dsred2-nuc) embryos at 48 hpf at the level of the arterial pole. Dotted lines indicates the eGFP signal shown in J; arrows in K indicate the most distal outflow tract cells that are positive for eGFP but negative for DsRed. The signal within the heart lumen detected in K but not in J is derived from background fluorescence from red blood cells. Scale bar: 25 μm. (L) Schematic of the location of the eGFPposDsRedpos cells (yellow) and the eGFPposDsRedneg (green) cells in the arterial pole. (M-R) Reconstruction of confocal z-stacks of Tg(cmlc2:Kaede) embryos with the arterial pole of the heart tube to the top. (M-O) Tg(cmlc2:Kaede) embryos photoconverted at 19 hpf and imaged at 26 hpf with the green unconverted signal shown in gray in M, the converted red signal in gray in N and a merged image in O. The arrow indicates the location of atrial cells that are green but not red, indicating that they were not expressing the transgene at the time of photoconversion. The dotted line indicates the green signal at 26 hpf. V, ventricle; A, atrium. (P-R) Tg(cmlc2:Kaede) embryos photoconverted at 34 hpf and imaged at 48 hpf with the green unconverted signal shown in gray in P, the converted red signal in gray in Q and a merged image in R. Images are of a partial reconstruction of confocal z-stacks, allowing a view into the ventricle chamber. The dotted line indicates the green signal at 48 hpf; the arrow in Q indicates the location of distal outflow tract cells that are green but not red, indicating that they were not expressing the transgene at the time of photoconversion. |
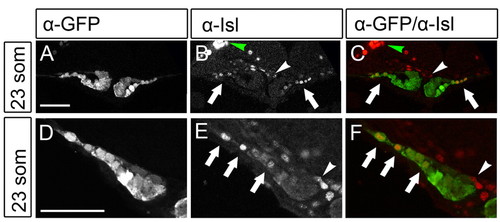
Isl localization in cardiomyocytes of the future atrium. (A-F) Isl is expressed in cardiac cells located at lateral positions in the cardiac disk. Single z-scans of confocal images of Tg(cmlc2:eGFP) embryos at 23 somites immunofluorescently stained with α-eGFP and α-Isl antibodies. C and F show an overlay with eGFP in green and Isl in red. Images in D-F are magnified views of one side of the cardiac disk. Arrows indicate the eGFPposIslpos cells located at lateral positions (future atrium) of the cardiac disk. The white arrowhead indicates Isl-positive cells in the endocardium and the green arrowhead indicates the Isl signal in the trigeminal sensory ganglion. Scale bars: 50 μm. EXPRESSION / LABELING:
|
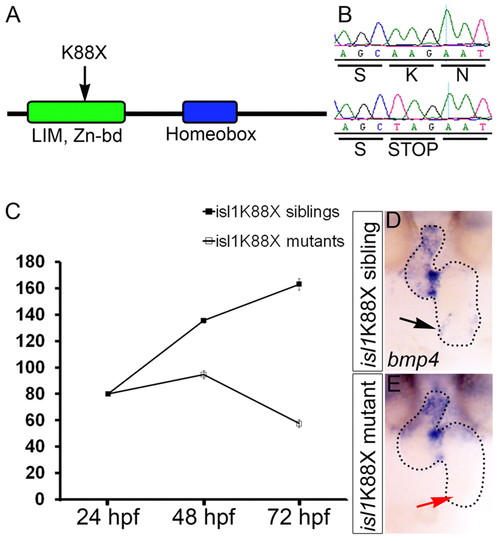
Cardiac defects of isl1K88X mutant embryos. (A) Cartoon of the Isl1 protein with the location of the premature stop codon (K88X) identified in the isl1 mutant. (B) DNA sequence of a homozygous wild-type sibling (top) and a homozygous isl1K88X mutant (bottom) at the site of the mutation (AAG>TAG) that results in a premature stop codon. (C) The number of heart beats per minute measured at 24, 48 and 72 hpf of wild-type sibling (black squares) and isl1 mutant (white squares) embryos. (D,E) In situ hybridization for bmp4 on 48 hpf wild-type sibling (D) and isl1 mutant (E) embryos. Black arrow (D) indicates bmp4 expression in the sinus venosus of a wild-type embryo; red arrow (E) indicates the inflow area of a representative isl1 mutant embryo lacking bmp4 expression. Embryos are shown as frontal-ventral views (OFT to the top). EXPRESSION / LABELING:
PHENOTYPE:
|
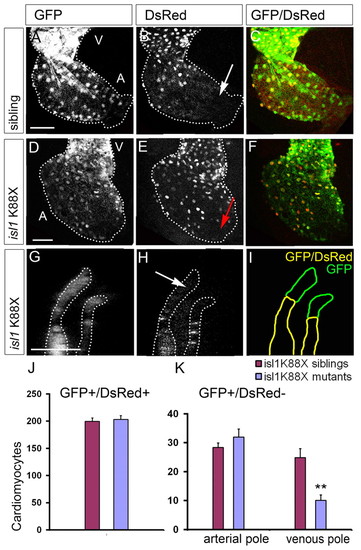
Reduced cardiomyocyte differentiation at the venous pole in isl1 mutant embryos. (A-F) Single z-scan of the atrium of a representative isl1K88X sibling (A-C) and mutant (D-F) embryo. White arrow (B) indicates eGFPposDsRedneg cardiomyocytes at the venous pole of the wild-type sibling heart; red arrow (E) indicates the venous pole of the isl1 mutant where only very few eGFPposDsRedneg cells are present. (G,H) Single z-scan of a confocal image at the level of the arterial pole showing the eGFPposDsRedneg cardiomyocytes in the isl1 mutant (white arrow). The region shown is similar to that of the control embryo shown in Fig. 2G-I. V, ventricle: A, atrium. Scale bar: 50 μm. (I) Schematic of the location of the eGFPposDsRedpos cells (yellow) and the eGFPposDsRedneg (green) cells in the arterial pole of the isl1 mutant. (J,K) The number of eGFPposDsRedpos (J) and eGFPposDsRedneg (K) cardiomyocytes per embryo. (K) The eGFPposDsRedneg cardiomyocytes are subdivided into eGFPposDsRedneg cells being present at either the arterial or the venous pole. Note the significant reduction of eGFPposDsRedneg cells at the venous pole in the isl1 mutants. Bars represent mean±s.e.m. **P<0.01. |
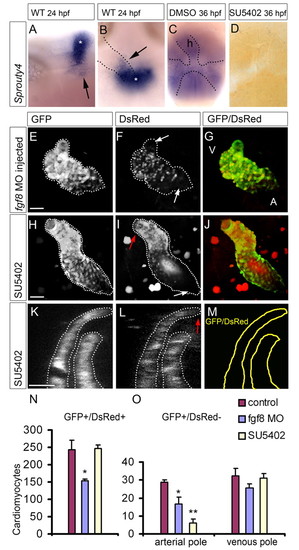
Fgf signaling is required for the addition of cardiomyocytes to the arterial pole. (A-D) In situ hybridization for sprouty4 (spry4). (A,B) Lateral (A) and dorsal (B) view of a 24 hpf embryo. The arrows indicate the region of spry4 expression near the arterial pole of the heart tube, which could contribute cells to the heart tube. The asterisk indicates the midbrain-hindbrain boundary. In B the heart tube is indicated by the dotted line. (C,D) Dorsal views of 36 hpf embryos that had been treated from 24 hpf until 36 hpf with DMSO (C) or SU5402 (D); spry4 expression in the DMSO-treated embryo is outlined by the dotted line. (E-J) Images of the developmental timing assay (similar to Fig. 2A-I). The arterial pole is at the top left. V, ventricle; A, atrium. The dotted line outlines the eGFP-positive heart tubes. Scale bars: 50 μm. (E-G) A representative fgf8 MO-injected embryo showing reduced heart size. The white arrows indicate the eGFPposDsRedneg cells at the poles of the heart. (H-J) A representative embryo treated with SU5402 from 24-48 hpf. The red arrow indicates the arterial pole, in which eGFPposDsRedneg are absent; the white arrow indicates the eGFPposDsRedneg cells at the venous pole. The peripheral red dots are background signal from yolk granules; the diffuse red signal within the heart tube is due to background fluorescence of red blood cells accumulated within the heart lumen. (K,L) Single z-scan of a confocal image taken from a Tg(cmlc2:eGFP)/Tg(cmlc2:dsred2-nuc) embryo treated with SU5402 from 24-48 hpf. A complete overlap of the eGFP (K) and DsRed (L) signals at the distal tip of the outflow (red arrow) was observed, in contrast to the control embryos represented in Fig. 2J,K. Scale bar: 25 μm. (M) Schematic of the location of the eGFPposDsRedpos cells after SU5402 treatment. (N,O) The number of eGFPposDsRedpos (N) and eGFPposDsRedneg (O) cardiomyocytes/embryo. (O) The eGFPposDsRedneg cardiomyocytes are subdivided into those present at the arterial pole and those present at the venous pole. Bars represent mean±s.e.m. Note the reduction in the number of eGFPposDsRedneg cells located at the arterial pole after fgf8 MO-injection or SU5402 treatment. *P<0.05; **P<0.01. |
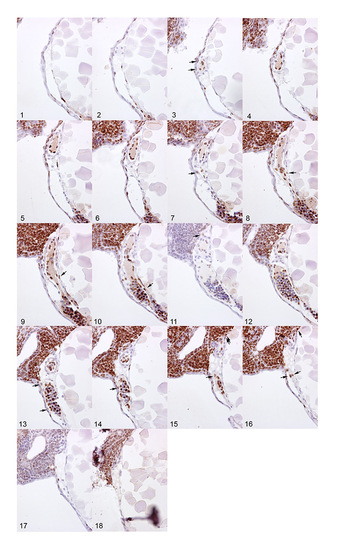
BrdU pulse labeling of cardiac cells. Sagittal sections of a single embryo after pulse labeling with BrdU from 24-48 hpf. The sections were immunohistochemically stained with an α-BrdU antibody (brown) and counter-stained with Hematoxylin and Eosin (blue). Arrows indicate BrdU-positive myocardial cells. Note the high degree of labeling within the embryonic blood cells and endocardial cells. Anterior is to the left, dorsal to the top. |
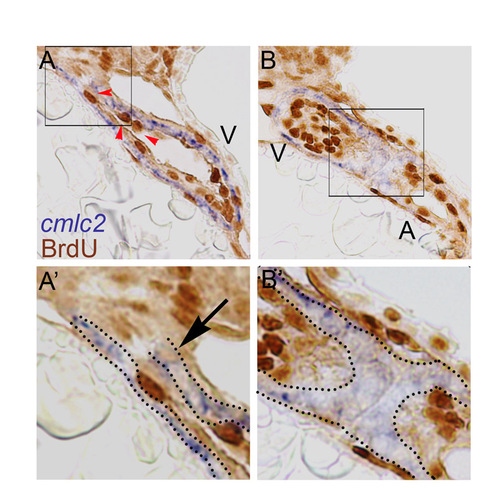
Double labeling of BrdU and cmlc2. (A,A′,B,B′) Representative sections of BrdU-soaked embryos from 24 hpf until 48 hpf stained for cmlc2 in blue and BrdU in brown. These sections show that in the tissue expressing the cardiac marker cmlc2 very few cells are positive for BrdU (black arrow). The tissue lining the myocardium (the endocardium) is negative for cmlc2 and is highly proliferative, indicated by red arrowheads. Quantitation of the number of BrdU-positive cells within the cmlc2-positive area resulted in a similar number to that previously described in the results section (6±2, mean±s.e.m., n_5). |
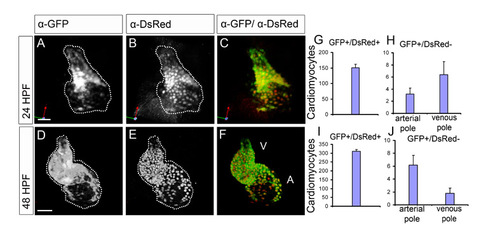
eGFP and DsRed protein expression overlaps at 24 hpf and 48 hpf. (A-F) Reconstruction of confocal z-stacks of Tg(cmlc2:eGFP)/Tg(cmlc2:DsRed) embryos at 24 hpf and 48 hpf. Hearts stained immunohistochemically with α-eGFP (A,D) and α-DsRed (B,E) antibodies. C and F represent the overlay. At 24 hpf and at 48 hpf, both eGFP and DsRed protein expression overlaps throughout the heart, with the exception of a few cells. (G-J) The number of cells in Tg(cmlc2:eGFP)/Tg(cmlc2:DsRed) hearts that are eGFPposDsRedpos (G,I) or eGFPposDsRedneg (H,J; mean±s.e.m., n_5). The eGFPposDsRedneg cardiomyocytes are subdivided into those present at the arterial pole and those present at the venous pole (24 hpf, 3±1 and 6±2; 48 hpf, 6±1 and 2±1, respectively). Note that almost all cardiomyocytes are eGFPposDsRedpos (24 hpf, 151±12; 48 hpf, 311±10). |
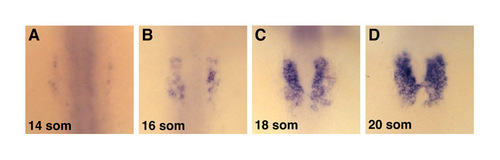
The number of cmlc2-expressing cells increases gradually over time. (A-D) In situ hybridization for cmlc2 in wild-type embryos; dorsal views, anterior to the top. (A) At the 14-somite stage, only a few cells have initiated cmlc2 expression. (B) By the 16-somite stage, more cmlc2-expressing cells are detectable. These cells appear to be located near the medial edge of the lateral plate mesoderm, which is migrating towards the embryonic midline. (C) More cmlc2-expressing cells are evident by the 18-somite stage. As the bilateral cardiomyocyte populations prepare to fuse, cmlc2 expression appears to be spreading laterally within the lateral plate mesoderm. (D) Continued increase in the lateral expansion of cmlc2-expressing cells is apparent at the 20-somite stage, as cardiac fusion begins. The medial-to-lateral spread of cmlc2 expression within the lateral plate mesoderm suggests that cmlc2 expression in ventricular cells precedes cmlc2 expression in atrial cells, as ventricular precursors are located in the medial portion of the lateral plate mesoderm and atrial precursors are located more laterally (Berdougo et al., 2003; Glickman and Yelon, 2002; Schoenebeck et al., 2007) |
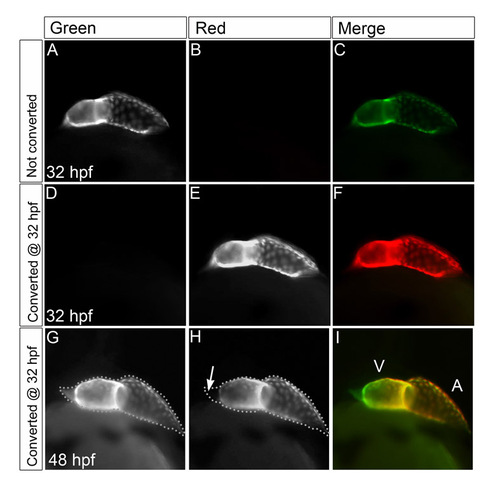
Photoconversion of Kaede efficiently marks differentiated cardiomyocytes. (A-I) Lateral views of Tg(cmlc2:kaede) embryos, ventricle to the left, demonstrating effectiveness of photoconversion technique. (A-C) Prior to photoconversion, the 32-hpf heart exhibits green Kaede fluorescence (A) but not red Kaede fluorescence (B), resulting in an entirely green heart (C). (D-F) Immediately after exposure to UV light, all of the green Kaede (D) has been converted into red Kaede (E), resulting in an entirely red heart (F). (G-I) Sixteen hours after photoconversion, red Kaede (H) persists in the cells that were expressing the transgene. These cells also generate new green Kaede (G), as do newly differentiating cells that initiated transgene expression after 32 hpf. As a result, cardiomyocytes at the arterial pole fluoresce green, but not red, at 48 hpf (arrow in H). V, ventricle; A, atrium. |
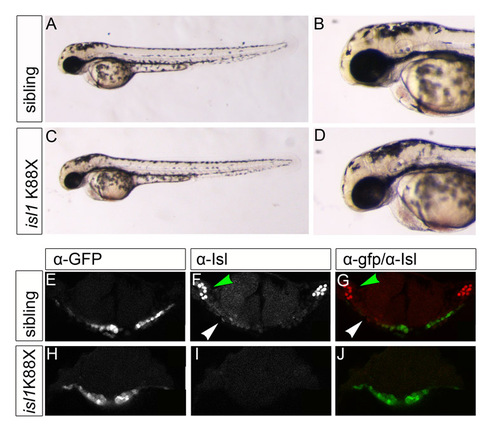
isl1K88X mutant embryos are deficient for Isl protein. (A-D) Live images of 48-hpf isl1K88X sibling and mutant embryos showing no apparent morphological phenotype. (E-J) Single z-scans of confocal images of 23-somite stage isl1K88X Tg(cmlc2:eGFP) embryos after immunofluorescence staining with α-eGFP (E,H) and α-Isl (F,I) antibodies. (E-G) isl1K88X sibling embryo; (H-J) isl1K88X mutant embryo. Arrowheads in the overlay of α-eGFP (green) with α-Isl (red) indicate the eGFPposIslpos cells in the cardiac disk and trigeminal sensory ganglia. In the control (E-G), Isl is expressed in cardiac cells located at lateral positions in the cardiac disk (white arrowhead) and in the trigeminal sensory ganglion (green arrowhead), described in Fig. 3A-C. Note that the nuclear Isl signal in the cardiac disk in H-J is absent. Scale bars: 80 μm. |
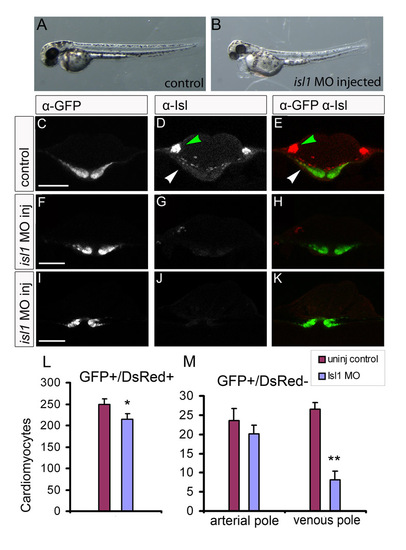
isl1 morpholinos reduce Isl1 protein and phenocopy the isl1 mutant in the developmental timing assay. (A,B) Live images of a representative control embryo and an embryo that was injected with the isl1 MO. isl1 morphants present with cardiac edema and loss of motility. (C-K) Single z-scans of confocal images of 23-somite stage Tg(cmlc2:eGFP) embryos after immunofluorescence staining with α-eGFP (C,F,I) and α-Isl (D,G,J) antibodies. (C-E) Control injected embryo; (F-H,I-K) examples of isl1 morphants. Arrowheads in the overlay of α-eGFP (green) with α-Isl (red) indicate the eGFPposIslpos cells in the cardiac disk. In the control (C-E), Isl is expressed in cardiac cells located at lateral positions in the cardiac disk (white arrowhead) and in the trigeminal sensory ganglion (green arrowhead), described in Fig. 3A-C. Note that the nuclear Isl signal in the cardiac disk in F-H and I-K is absent; however, some signal is still present in the trigeminal sensory ganglion in F-H. Scale bars: 80 μm. (L,M) The number of eGFPposDsRedpos (L) and eGFPposDsRedneg (M) cardiomyocytes/embryo. (M) The eGFPposDsRedneg cardiomyocytes are subdivided into those present at the arterial pole and those present at the venous pole. Note the significant reduction of eGFPposDsRedneg cells at the venous pole in the isl1 morphant embryos. Bars represent mean±s.e.m. *P<0.05; **P<0.01. |
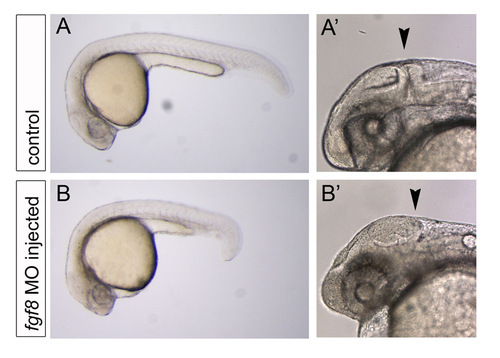
fgf8 MO injection results in reduced Fgf signaling. (A,A′,B,B′) Live images of control embryos (A,A′) or fgf8 MO-injected embryos (B,B′). As previously shown by Draper et al. (Draper et al., 2001), the fgf8 MO used generates a range of phenotypic classes (Draper et al., 2001). In our experiments, injected embryos exhibited phenotypes similar to those described as class 1-3 phenotypes, most typically the class 2 phenotype (Draper et al., 2001). fgf8 MO-injected embryos were selected for the absence of the midbrain-hindbrain boundary, indicated by the black arrowhead. Approximately 40% of the injected embryos presented this phenotype and only these were imaged in the developmental timing assay. |

Unillustrated author statements |