
- Title
-
Increased Hox activity mimics the teratogenic effects of excess retinoic acid signaling
- Authors
- Waxman, J.S., and Yelon, D.
- Source
- Full text @ Dev. Dyn.

Increased RA signaling and Hox activity cause similar body axis phenotypes. A: Wild-type embryo. B: Low RA causes reduction of anterior head. C: High RA causes loss of anterior head and tail truncation. D, E: Injection of 150 pg of hoxb5b mRNA causes reduction or loss of anterior head. F: Injection of 30 pg of vp-hoxb5b mRNA causes loss of anterior head. G: Injection of 60 pg of vp-hoxb5b mRNA causes loss of anterior head and tail truncation. All images are at 48 hpf with anterior to the left. Arrows indicate reduced head and eyes. Arrowheads indicate loss of anterior head. Scale bar = 100 μM. |

Increased RA signaling and Hox activity have similar effects on the anterior CNS. A-F: In situ hybridizations at the 8-somite stage with a cocktail (cktl) of probes including pax2a (eye and MHB), krox-20/egr2b (rhombomeres 3 and 5), and myod (somites). B,C,E,F: High RA treatment (HRA) or injection with 60 pg of vp-hoxb5b mRNA cause severe posteriorization phenotypes that vary between individual embryos. B,E: High RA treatment and 60 pg vp-hoxb5b mRNA injection can truncate the anterior CNS, eliminate the MHB, and dramatically expand the posterior hindbrain. C,F: High RA treatment and 60 pg vp-hoxb5b mRNA injection can also dramatically reduce or eliminate anterior CNS markers. D: 150 pg hoxb5b mRNA injection causes loss of rhombomere 3, consistent with what has been shown previously for hoxb5b mRNA injection and for modest increases in RA signaling (Bruce et al.,[2001]; Hernandez et al.,[2007]). All images are lateral views, with dorsal to the right and anterior up. Arrows in A and D, MHB; arrowheads in A, rhombomeres 3 and 5; arrowheads in B, D, E, rhombomere 5. |
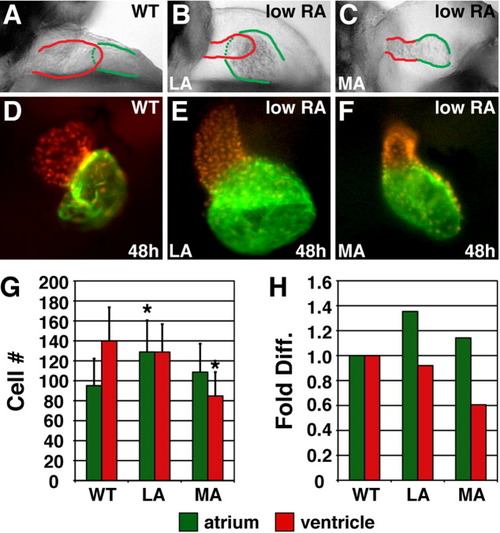
Excess RA signaling independently affects atrial and ventricular cell number. A-C: Lateral views of hearts at 48 hpf; red and green outlines indicate ventricle and atrium, respectively. D-F: Frontal views of Tg(cmlc2:DsRed2-nuc) (Mably et al.,[2003]) hearts, displaying nuclear DsRed in all cardiomyocytes, with Amhc immunofluorescence (green). G: Mean (±SD) number of atrial and ventricular cardiomyocytes. WT, n = 22; LA, n = 45; MA, n = 26. H: Fold difference of the means in G. Asterisks, statistically significant differences from WT (P < 0.005, Student's t-test). |

Low RA treatment can cause an increase in amhc expression. A-F: In situ hybridizations at the 20- or 22-somite stage; dorsal views, anterior up. Arrow in C, endocardial precursors. G: Mean (±SD) of areas of amhc and vmhc expression. WT amhc, n = 43; WT vmhc, n = 31; low RA amhc, n = 18; low RA vmhc, n = 25. H: Fold difference in means in G. Asterisk, statistically significant differences from WT (P < 0.005, Student's t-test). |

Increased RA signaling and Hox activity have similar effects on the ALPM. A-L: In situ hybridizations of hand2 (A-F) and gata4 (G-L) in RA-treated, hoxb5b mRNA-injected, and vp-hoxb5b mRNA-injected embryos at the 8-somite stage. D: Injection of 150 pg hoxb5b mRNA can cause a slight anterior shift in hand2 expression in the LPM. B,E,H,K: Low RA (LRA) treatment or injection of 30 pg of vp-hoxb5b mRNA can shift hand2 anteriorly and reduce the length of gata4 expression. The uneven effects on either side of the embryo are likely due to mosaic distribution of the injected mRNA. C,F,I,L: High RA (HRA) treatment or injection of 60 pg of vp-hoxb5b mRNA can eliminate hand2 and gata4 expression. All views are dorsal with anterior up. Asterisks, the anterior head; arrowheads, the anterior and posterior borders of expression in the LPM. |

Increased Hox activity reduces atrial and ventricular cell number. A-C: Hearts from WT, hoxb5b mRNA-injected (150 pg), and vp-hoxb5b mRNA-injected (60 pg) embryos. D: Mean (±SD) number of atrial and ventricular cardiomyocytes. WT, n = 25; hoxb5b mRNA, n = 30; vp-hoxb5b mRNA, n = 42. E: Fold difference of means in D. Asterisks, statistically significant differences from WT (P < 0.005, Student's t-test). All views and graphs are as presented in Figure 3. |

Increased Hox activity reduces amhc and vmhc expression. A-F: Cardiomyocytes from WT, hoxb5b mRNA-injected (150 pg), and vp-hoxb5b mRNA-injected (60 pg) embryos. G: Mean (±SD) of areas of amhc and vmhc expression. WT amhc, n = 48; hoxb5b mRNA amhc, n = 53; WT vmhc, n = 59; hoxb5b mRNA vmhc, n = 53. H: Fold difference of means in G. Asterisk, statistically significant difference from WT (P < 0.005, Student's t-test). All views and graphs are as presented in Figure 4. |