
- Title
-
Molecular cloning and expression of phospholipase C epsilon 1 in zebrafish
- Authors
- Zhou, W., and Hildebrandt, F.
- Source
- Full text @ Gene Expr. Patterns

Expression of plce1 by RT-PCR. The maternal transcripts of plce1 are detected in fertilized eggs and the zygotic transcripts of plce1 are detected at 14 hpf and 23 hpf. β-actin is used as the internal reference of RT-PCR. EXPRESSION / LABELING:
|

Expression of plce1 at 24 hpf. (A) Lateral view showing the expression of plce1 in the brain, particularly two stripes in the hindbrain and in the developing notochord at 16 hpf. (B) Dorsal view showing that plce1 is expressed extensively in the brain, the eyes and the midbrain–hindbrain boundary (MHB) (arrow). (C) Dorsal view showing that plce1 is expressed strongly in the MHB (arrow) and two rhombomeric segments in the hindbrain (r3 and r5). (D) Lateral view of the trunk showing that plce1 is expressed throughout the somites with a rostral-to-caudal gradient. Inset: transverse section showing plce1 expression in superficial muscle layer and the horizontal myoseptum at 24 hpf. sc: spinal cord. (E) Representative images showing plce1 (red) is expressed in muscle pioneer cells (monoclonal antibody 4D9, green) in somitic segments 4–6 and 21–22 but not in the caudal-most segments 23–24 at 24 hpf. ss: somitic segments. (F) Lateral view of the tail region showing plce1 expression is high at the tip of the extending notochord and the developing cloaca (arrow). Inset: sagittal section of the cloaca region. (G–I) Transverse sections of 24 hpf, 32 hpf, and 36 hpf embryos showing the plce1 expression in developing pronephric glomerular primordium (arrows). EXPRESSION / LABELING:
|
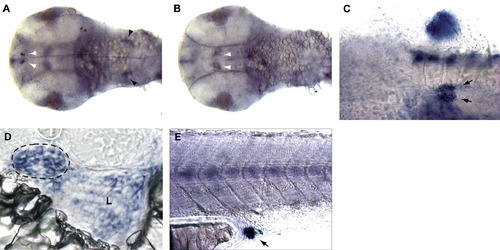
Expression of plce1 at 48 hpf. (A) Dorsal view of the head region showing plce1 expression in two groups of cells (white arrowheads) at the dorsal forebrain flanking the pineal gland and two groups of cells (black arrowheads) in the hindbrain. (B) Ventral view of the head region showing plce1 expression in two groups of cells in the ventral midbrain. (C) Ventral view of the trunk showing plce1 expression in two developing pronephric glomeruli (arrows) prior to complete fusion and the pectoral fin bud. (D) Transverse section showing plce1 expression in pronephric glomeruli (dashed circle) and liver (L). (E) Lateral view showing plce1 expression in the somites (particularly the horizontal myoseptum) and the cloaca (arrow). EXPRESSION / LABELING:
|
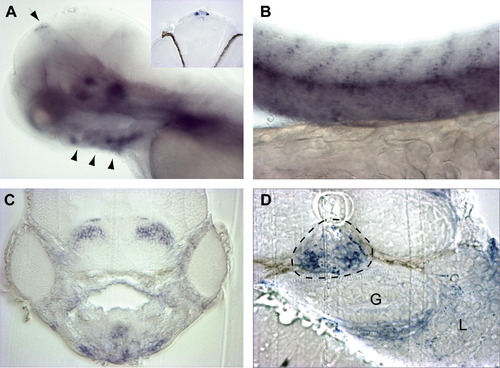
Expression of plce1 at 72 hpf. (A) Lateral view of head showing plce1 expression is restricted to a few groups of cells in the midbrain, a group of cells at the top of the dorsal forebrain (arrow, inset shows the transverse section of the dorsal forebrain) and the branchial cartilages (arrowheads). (B) Lateral view showing expression of plce1 in skeletal muscle persists at 72 hpf. (C) Transverse section showing plce1 expression in two symmetric groups of cell in the midbrain and in the pharyngeal cartilages. (D) Transverse section showing plce1 is expressed in the fused pronephric glomeruli (dashed circle) at the midline and in the liver (L), but absent from the gut (G). EXPRESSION / LABELING:
|
Reprinted from Gene expression patterns : GEP, 9(5), Zhou, W., and Hildebrandt, F., Molecular cloning and expression of phospholipase C epsilon 1 in zebrafish, 282-288, Copyright (2009) with permission from Elsevier. Full text @ Gene Expr. Patterns