
- Title
-
The characterization of a zebrafish mid-hindbrain mutant, mid-hindbrain gone (mgo)
- Authors
- Shima, T., Znosko, W., and Tsang, M.
- Source
- Full text @ Dev. Dyn.
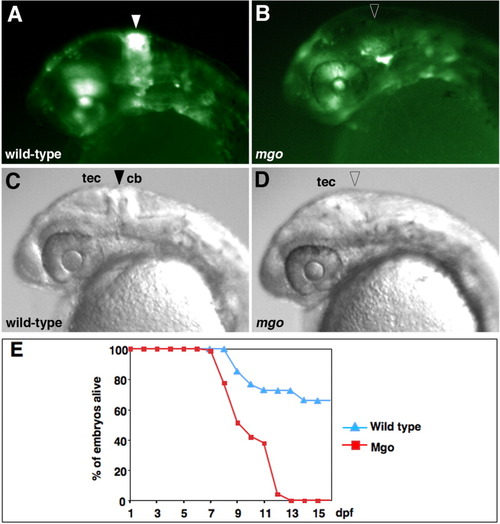
Lateral views of mgo mutant embryos. A: Tg(Dusp6:d2EGFP)pt10 embryo at 24 hpf. B: mgo mutant, which lacks expression of d2EGFP in the MHB region. MHBs of WT and mgo are marked by closed and open arrowhead, respectively. C,D: Bright-field images of a wild-type sibling and mgo mutant embryo. A partial tectum formed but the cerebellum and MHB were not observed (D). E: Survival rates of mgo mutants. cb, cerebellum; tec, tectum. |
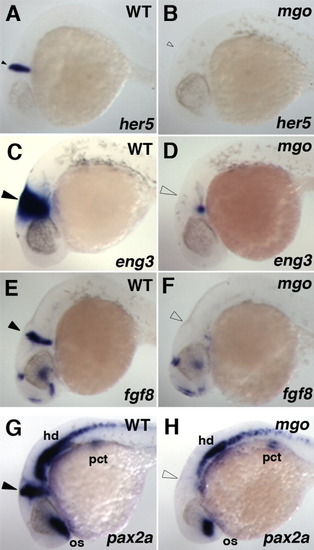
Expression of MHB genes in mgo mutants. A-H: Lateral views, anterior to the left of wildtype and mgo embryos at 24 hpf with marker genes indicated at the bottom. A,B: Expression of her5 was absent in mgo mutants (B). C,D: eng3 expression was restricted to the ventral region (D). E,F: fgf8 expression in the MHB region was lost (F). G,H: pax2a expression in the MHB region was absent. os, optic stalk; hd, hindbrain; pct, proximal convoluted tubule. MHBs of mgo and wild-type siblings are marked by open and closed arrowheads, respectively. EXPRESSION / LABELING:
|
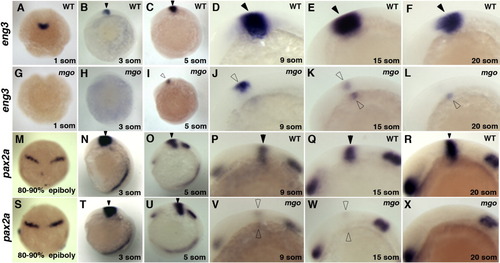
Expression profiles of eng3 and pax2a in mgo mutants. Dorsal views (A, G, M, S) of embryos with anterior at the top; lateral views (B-F, H-L, N-R, and T-X) with anterior to the left. A-L: Analysis of eng3 expression in wild-type (A-F) and mgo homozygous mutants (G-L). eng3 expression was not observed in mgo mutants from the 1- to 3-somite stage (G and H). However, weak eng3 expression did initiate around the 5-somite stage (I) in mgo mutants and remained in the dorsal region at the 9-somite stage (J). Later, reduced expression was detected in both the dorsal and ventral region at the 15-somite stage (K). Expression within the dorsal region disappeared while weak expression remained in the ventral region in the 20-somite stage (L). M-X: pax2a expression in wild-type (P-R) and mgo (V-X) mutants. Expression of pax2a was initiated within the MHB primordia at 80-90% epiboly (M,S) and was consistant at the 3- and 5-somite stages (N,O,T,U). By the 9-somite stage, pax2a expression started to decrease in mgo mutants and remained weak at the 15-somite stage (V,W). pax2a expression was completely eliminated by the 20-somite stage (X). Developmental stage and genotype are indicated in the bottom and top right-hand corner of each image, respectively. mgo mutant MHBs are shown by open arrowheads. EXPRESSION / LABELING:
|
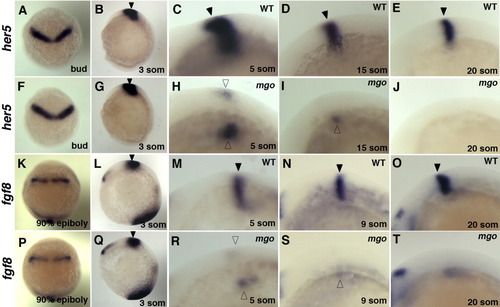
her5 and fgf8 expression profile in mgo mutants. Dorsal views (A, F, K, P) of embryos with anterior at the top; lateral views (B-E, G-J, L-O, and Q-T) with anterior to the left. A-J: Analysis of her5 expression in wild-type (C-E) and mgo mutants (H-J). At the bud and 3-somite stage, no difference was detected in her5 expression (A,B,F,G). By 5-somite stage, lower her5 expression was noted in mgo mutants (H). her5 expression remained only in the ventral region at the 15-somite stage and disappeared completely by the 20-somite stage (I,J). K-T: fgf8 expression in Wild-type (M-O) and mgo homozygous mutants (R-T). Expression of fgf8 initiated in all embryos within the MHB primordia at 90% epiboly and remained at the 3-somite stage (K, L, P, Q). By the 5-somite stage, fgf8 expression was reduced especially in dorsal region (R). Expression of fgf8 remained within the ventral region at the 9-somite stage (S) and was absent by the 20-somite stage (T). Developmental stages and genotype are indicated in the bottom and top right-hand corner, respectively. Open arrowheads point to mgo MHBs. EXPRESSION / LABELING:
|
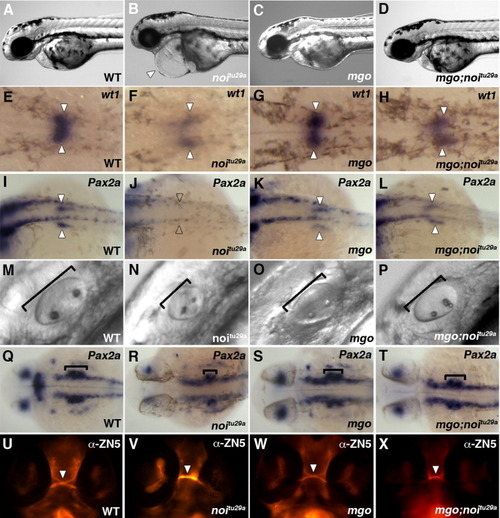
Comparison of mgo and noitu29a mutant phenotypes. A-D: Lateral view of 48-hpf embryos. noitu29a mutant with severe edema (arrowhead) (B). Wiltype (A), mgo (C), and mgo/+;noi/+ (D) did not show edema phenotype. E-H: wt1 expression in Wild-type, noitu29a, mgo, and mgo/+;noi/+ embryos at 30 hpf as indicated. Arrowheads mark the pronephric primordial. wt1 expression in the pronephric primordial was significantly reduced and caudally expanded in noitu29a (F), whereas expression in the mgo was normal (G). In the mgo/+;noi/+ embryos, wt1 expression was expanded slightly (H). I-L: Dorsal views of 24 hpf, showing proximal convoluted tubules (arrowheads) as marked by pax2a expression. In noitu29a, the proximal convoluted tubules were absent (J), whereas pax2a expression in the mgo and the mgo/+;noi/+ embryos were normal (K,L). M-P: Lateral view images of 24-hpf embryos showing smaller otic vesicles in noitu29a (N). Q-T: Dorsal views of 24-hpf embryos stained for pax2a expression in the otic vesicle. Brackets delineate ear size. The otic vesicle of noitu29a embryos (R) were smaller than the wild-type (Q), mgo (S), and mgo/+;noi/+ (T) embryos. U-X: Dorsal views of 48-hpf embryos stained with anti-ZN5 antibody. The optic chiasms are indicated by arrowheads. In the wild-type embryo (U), the optic axons from the eyes cross completely in the optic chiasm. In the noitu29a mutant (V), the optic axons from one eye ran into the axons from the other eye, whereas in mgo (W) and mgo/+;noi/+ (X) embryos, the optic axons were normal. |
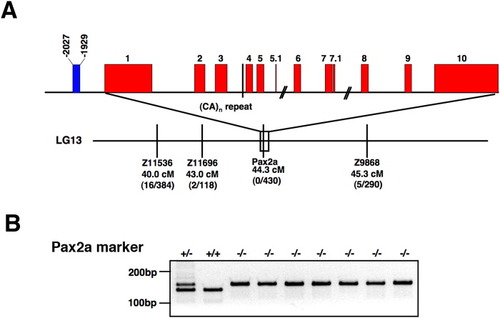
Genetic mapping of mgo. A: Genomic structure of the pax2a gene and SSLP markers around the Pax2a locus. The CA marker in intron 3 is indicated by the line on the genome structure. The markers, the distances, the number of recombination events, and the number of meiosis tested are shown. The putative enhancer region is indicated by a blue box. Nucleotide positions are shown relating to the transcription start site. B: Genotype analysis of single embryos with a marker in the pax2a gene. Genotypes are indicated by + (wild type, WIK) and - (mutant, AB*). |
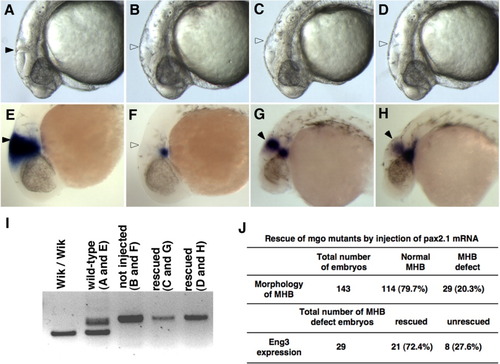
Microinjection of pax2a mRNA rescued eng3 expression. pax2a mRNA (50 pg) was injected into 1-cell-stage embryos derived from heterozygous Wik/AB* mgo incross. Embryonic genotypes and marker gene are indicated at the bottom and top, respectively. A-H: Lateral views of the MHB at 24 hpf embryos of wild type sibling (A), mgo (B), and mgo injected with pax2a mRNA (C,D). In situ hybridization with eng3 (E-H). Wild-type embryos had a distinct MHB structure and eng3 mRNA was expressed strongly at MHB region (A,E). In the mgo mutant, the MHB structure was absent and eng3 expression was limited to the ventral region (B,F). pax2a mRNA injected into a clutch of embryos derived from an mgo incross showed 20.3% with the MHB phenotype. However, eng3 expression was expanded in both the ventral and dorsal region (C,D,G,H). I: Embryos genotyped by PCR with a pax2a intron 3 marker. Wild-type, Wik/Wik background, yields lower band. Heterozygote Wik/AB* background yields two bands, and homozygous mutants showed an upper single band. J: Summary of rescue experiment. |
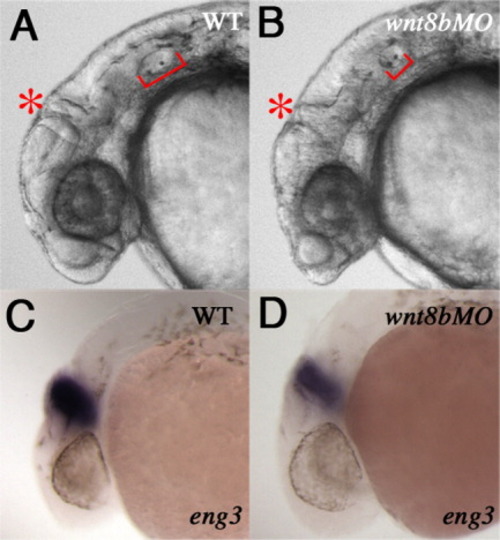
Knockdown of wnt8b results in MHB defects and diminished eng3 expression. A,B: Lateral views of uninjected embryos (A) and knockdown of wnt8b (B) at 28hpf. C,D: eng3 expression in control uninjected (C) and wnt8bMO-injected (D) embryos. Asterisks and brackets mark MHB and otic vesicle, respectively. |