
- Title
-
hnRNP I Inhibits Notch Signaling and Regulates Intestinal Epithelial Homeostasis in the Zebrafish
- Authors
- Yang, J., Chan, C.Y., Jiang, B., Yu, X., Zhu, G.Z., Chen, Y., Barnard, J., and Mei, W.
- Source
- Full text @ PLoS Genet.

The abnormal intestinal architecture in brom bones. (A) brom bones displays an enlarged abdomen (arrow) as compared to a wild-type sibling. (B) The dissected intestine of the wild-type fish shown in (A). The original coiled intestine tube was unfolded for a better view. Lines indicate the borders between anterior, mid and posterior intestines. (C) The intestine dissected from the brom bones mutant shown in (A). Note the abundant food waste in the intestine. Double arrows indicate the clear portion in the anterior intestine. Anterior is toward left. (D–K) Hematoxylin and Eosin (H&E) staining on cross-sections of the intestines from a wild-type fish (D and I), a brom bones heterozygous fish (E,J), and brom bones homozygous fish (F, G, H, and K). (D–H) From the anterior segments of the intestine. (I–K) From the mid segments. Arrows in (D) point to goblet cells. The severity of the intestinal phenotype varies among individual homozygous mutants. (F) represents brom bones homozygous intestines that display markedly reduced goblet cells. (G) represents brom bones homozygous intestines that exhibit excessive number of the intestinal epithelial cells and lack visible lamina propria. (H) is the cross-section of the brom bones intestine shown in (C), representing mutants with the big abdomen phenotype. Note that both the intestinal epithelium and the smooth muscle layer undergo degeneration. brb = brom bones; wt = wild-type; A = anterior intestine; M = mid intestine; P = posterior intestine. Scale bar = 50 μm. PHENOTYPE:
|

brom bones has significantly reduced number of intestinal goblet cells. (A,B) PAS-AB staining shows the intestinal goblet cells (arrowheads in A) in the anterior intestines of brom bones heterozygous fish (A) and homozygous fish (B). (C,D) The enzymatic activity of intestinal alkaline phosphatase (AP) in the enterocytes brush border (arrows) of the anterior intestines in brom bones heterozygous fish (C) and homozygous fish (D). (E) Quantification of the goblet cell number. Values shown are the percentages of goblet cells relative to the total number of intestinal epithelial cells per villous cross-section (n = 129 villi from 7 brom bones heterozygous fish and 154 villi from 9 brom bones homozygous fish). Error bars represent s.e.m; P = 1x10⁻⁶ by Student's t test. Scale bar = 50 μm. PHENOTYPE:
|

brom bones has increased cell proliferation and apoptosis in the intestinal epithelial cells. (A,B) Representative cross-sections of the anterior intestines from control and mutant fish immunostained for PCNA. Arrows in (A) mark the border of PCNA expression region in the intervillus pocket of a control fish. Arrowheads in (B) indicate PCNA-positive cells in the center region of intestinal epithelium of a brom bones homozygous fish. (C,D) Representative cross-sections of the anterior intestines from control (C) and mutant (D) fish immunostained for active caspase 3. Arrows point to caspase-positive cells. (E) Quantification of the PCNA-positive cell number. Values shown are the percentages of PCNA-positive cells relative to the total number of intestinal epithelial cells per villous cross-section (n = 97 villi from 6 brom bones heterozygous fish and 98 villi from 8 brom bones homozygous fish). Error bars represent s.e.m; P = 2x10⁻⁴ by Student's t test. Scale bar = 50 μm. |
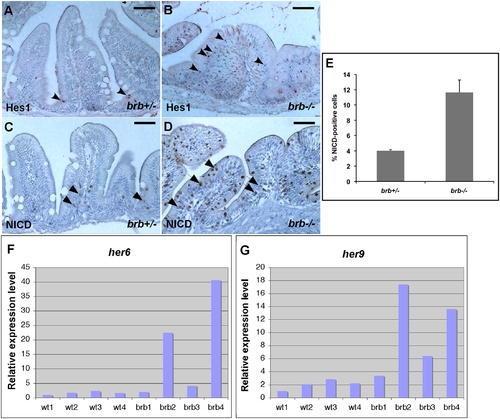
brom bones possesses an increased level of Notch signaling activity in the intestinal epithelium. (A–D) Cross-sections of the anterior intestines from control (A,C) and mutant fish (B,D) immunostained for Hes1 (A,B) and NICD (C,D). Arrowheads in A and B point to Hes1 positive-cells. Arrows in (C) and (D) indicate NICD-positive cells. (E) Quantification of the NICD-positive cell number. Values shown are the percentages of NICD-positive cells relative to the total number of intestinal epithelial cells per villous cross-section (n = 114 villi from 7 brom bones heterozygous fish and 175 villi from 10 brom bones homozygous fish). Error bars represent s.e.m; P = 0.001 by Student's t test. (F,G) Real-time RT-PCR results show the expression levels of her6 (F) and her9 (G) in the intestines of 4 wild-type fish and 4 brom bones homozygotes. The expression levels of her6 and her9 were normalized to odc. Gene expression levels in the wild-type 1 fish were set as 100%. Scale bar = 50 μm. |
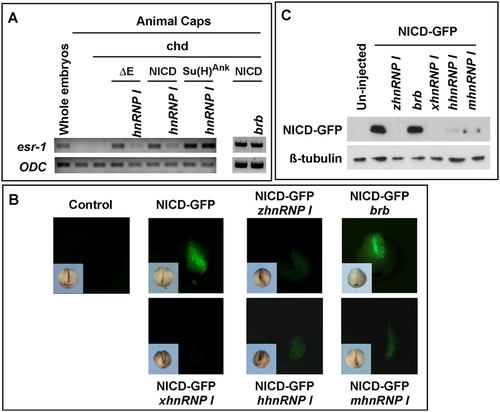
hnRNP I inhibits Notch signaling. (A) RT-PCR results demonstrate that hnRNP I (1 ng), but not brb (1 ng), inhibits the expression of esr-1 induced by Notch”E, NICD, but not that induced by Su(H)Ank in Xenopus animal caps. Animal caps were neuralized by chordin (Chd, 50 pg). (B) Stereoimages show hnRNP Is from the wild-type zebrafish (zhnRNP I, 2.5 ng), human (hhnRNP I, 2.5 ng), mouse (mhnRNP I, 2.5 ng) and Xenopus (xhnRNP I, 2.5 ng) decreased the level of NICD-GFP as revealed by the presence of green fluorescence. In contrast, the mutated form of hnRNP I in brom bones (brb) failed to reduce the level of NICD-GFP. Note that only one of the dorsal animal blastomeres, which later gave rise to the neural tissue, was injected. Inserts at the lower left corner of each panel are bright field images. (C) Western blot result showing the level of NICD-GFP (upper panel) was reduced by overexpression of hnRNP Is. Protein extracts were made from 15 injected embryos (20 ml lysis buffer per embryo). Each lane contains 10 ml lysate. After Western blot with the anti-GFP antibody, the membrane was re-probed with anti-tubulin antibody (lower panel). |

C-terminal region of RAM domain mediates the hnRNP I-induced NICD turnover. (A) Schematic representation of serial deletion NICD constructs (left panel) and the Western blot results (right panel) showing that the RAM domain is required for hnRNP I-induced NICD turnover. Myc-GFP (pointed by arrow) was used as the control for microinjection and loading. * indicates NICD and NICD deletion constructs. (B) Schematic representation of RAM deletion constructs (left panel) and the Western blot results (right panel) demonstrating that the C-terminal region of RAM domain is required for hnRNP I-induced NICD turnover. Myc-GFP was used as the control for injection and loading (pointed by arrow). * indicates RAM and RAM deletion constructs. (C) Western blot result showing that overexpression of hnRNP I destabilized GST-RAMC protein purified from bacteria. GST-RAMC protein (250 pg per embryo) was injected alone, or together with hnRNP I RNA (2 ng) into Xenopus embryos. Control and injected embryos were harvested at the tailbud stage. A total volume of 1 ml lysate, which was prepared from 50 embryos, was incubated with 50 ml glutathione-agarose beads at room temperature for 1 hour to recover GST-RAMC protein. Protein was eluted from the beads and blotted with an anti-GST antibody (upper panel). Supernatants were probed with the anti-tubulin antibody (lower panel). |

NICD and Hes1 double immunostaining of the control and brom bones intestines. |

Unillustrated author statements PHENOTYPE:
|