
- Title
-
Hoxb5b acts downstream of retinoic Acid signaling in the forelimb field to restrict heart field potential in zebrafish
- Authors
- Waxman, J.S., Keegan, B.R., Roberts, R.W., Poss, K.D., and Yelon, D.
- Source
- Full text @ Dev. Cell
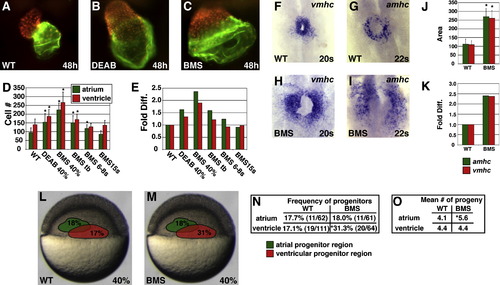
Reduction of RA Signaling Causes an Increase in the Number of Atrial and Ventricular Cells (A–C) Frontal views of hearts at 48 hpf expressing the transgene Tg(cmlc2:DsRed2-nuc) (red). Atria are labeled with the anti-Amhc antibody S46 (green). (B and C) Treatment with 1 μM DEAB or 10 μM BMS causes cardiac chamber enlargement. (D) Mean and standard deviation (SD) of numbers of atrial and ventricular cardiomyocytes. Stages indicate when DEAB or BMS treatment was initiated. Asterisks indicate statistically significant differences relative to wild-type (p < 0.005). (E) Fold difference in mean cell numbers relative to wild-type (WT) controls. (F–I) Reduction of RA signaling causes increased expression of amhc and vmhc. Dorsal views, anterior to the top at the 20 or 22 somite stage. (J) Mean and SD of areas of expression of amhc and vmhc in WT and BMS-treated embryos. Asterisks indicate statistically significant differences relative to WT (p < 0.005). (K) Fold difference in mean areas of gene expression relative to WT controls. (L and M) Schematic of 40% epiboly fate maps from WT and BMS-treated embryos indicating that the relative position of regions containing APs (green) and VPs (red) is unchanged when RA signaling is reduced. Percentages indicate the frequency of encountering APs or VPs in each region. (N) Reduction of RA signaling increased the frequency of encountering VPs, but not APs, at 40% epiboly. The asterisk indicates statistically significant difference relative to WT (p < 0.005). (O) Reduction of RA signaling increased the mean number of labeled progeny produced by APs but not VPs. The asterisk indicates statistically significant difference relative to WT (p < 0.05). EXPRESSION / LABELING:
|

RA Signaling Positively Regulates hoxb5b Expression in the LPM Expression of hoxb5b at the tailbud (tb) or 8 somite stages, dorsal views, anterior to the top. (A–D and F–I) Reduction of RA signaling inhibits hoxb5b expression, and treatment with RA induces ectopic hoxb5b expression. (E and J) Expression of the hoxb5b paralog hoxb5a. Identification of hoxb5b as a RA-responsive gene is not surprising, since the chick and mouse Hoxb5 orthologs and the zebrafish paralog hoxb5a have already been implicated as direct targets of RA signaling ([Bruce et al., 2001], [Grandel et al., 2002], [Oosterveen et al., 2003] and [Sharpe et al., 1998]). EXPRESSION / LABELING:
|
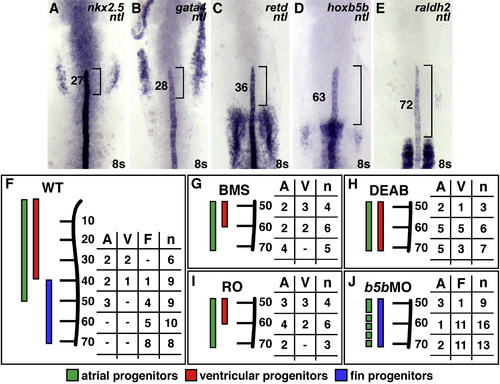
RA-Responsive Genes Are Expressed in the Forelimb Field (A–E) Expression of nkx2.5, gata4, retd, hoxb5b, and raldh2 relative to ntl, which marks the notochord; dorsal views of flatmounted embryos, anterior to the top, at the 8 somite stage. Brackets and numbers indicate the mean distance of the limit of gene expression relative to the tip of the notochord, measured in notochord cell diameters (ncds). (A and B) The posterior portions of nkx2.5 and gata4 expression overlap with the notochord. (C) retd expression is found posterior to nkx2.5 and gata4 expression. (D and E) hoxb5b is expressed closer to raldh2 expression in the somites, a major source of RA in the embryo. (F) Schematic of the WT LPM fate map at the 8 somite stage, indicating locations of atrial (green, A), ventricular (red, V), and fin (blue, F) progenitors relative to the anterior-posterior axis of the notochord, measured in ncds. Numbers in the table represent the number of labeling experiments in which each progenitor type was detected at a certain ncd position; n indicates the total number of experiments at each position. Experiments were performed on both the left and right sides of the embryo; no asymmetries were observed. (G–I) When RA signaling is reduced, FPs are absent and CPs frequently occupy FP territory. (J) In hoxb5b morphants, FPs are present and CPs rarely occupy FP territory. EXPRESSION / LABELING:
|
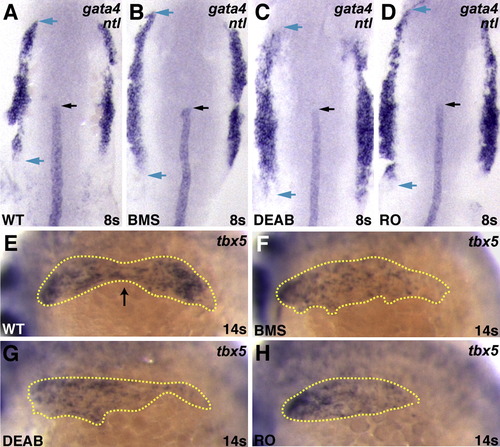
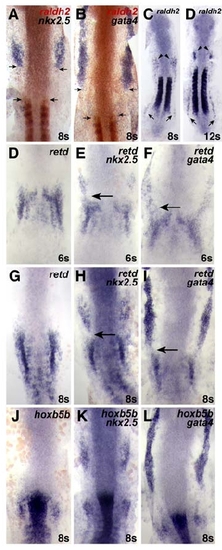
Altered Expression of gata4 and tbx5 in Embryos Deficient in RA Signaling (A–D) Expression at the 8 somite stage of gata4 and ntl in WT, BMS-treated, DEAB-treated, and RO-treated embryos; dorsal views, anterior to the top. When RA signaling is reduced, the total extent of gata4 expression is longer (blue arrows). This shift in gata4 expression is most prominent posterior to the notochord tip (black arrow). (E–H) Expression of tbx5 in WT, BMS-treated, DEAB-treated, and RO-treated embryos at the 12 somite stage; lateral views, anterior to the left. (E) In WT embryos at this stage, the total extent of tbx5 expression (yellow outline) is divided into two comparably sized populations; a black arrow indicates the separation point. (F–H) When RA signaling is reduced, the separation between populations is less evident. EXPRESSION / LABELING:
|
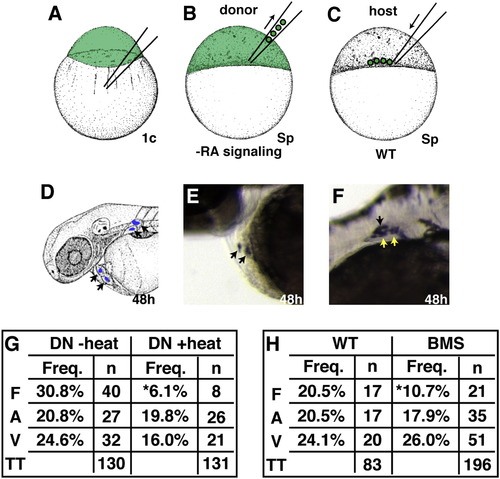
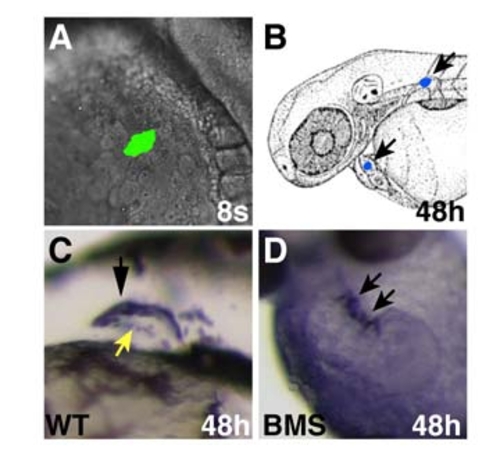
Mosaic Analysis Demonstrates a Cell-Autonomous Requirement for RA Signaling during Forelimb Formation (A–F) Experimental design for mosaic analysis. (A) Donor embryos were injected with fluorescein dextran at the one-cell stage. (B and C) At sphere stage, blastomeres from WT, Tg(hsp70:dnRARα), or BMS-treated donor embryos were transplanted into the margin of a WT host embryo. (D) At 48 hpf, progeny of donor-derived cells (arrows) were detected in the heart and fin by anti-fluorescein immunohistochemistry. (E) Mosaic embryo containing donor-derived cardiomyocytes. (F) Mosaic embryo containing donor-derived cells in pectoral fin. Only LPM-derived fin cartilage cells (yellow arrows), and not fin ectoderm (black arrow) or somite-derived fin muscle ([Haines and Currie, 2001] and [Neyt et al., 2000]), were scored as fin. (G and H) Frequency of heart and fin contributions from heat-shocked Tg(hsp70:dnRARα), non-heat-shocked Tg(hsp70:dnRARα), WT, or BMS-treated donor-derived cells. Percentages reflect the number of mosaic embryos exhibiting donor-derived fin mesenchyme (F), atrial (A), or ventricular (V) cardiomyocytes relative to the total number of transplantation (TT) experiments. Asterisks indicate statistically significant differences from WT (p < 0.05). |
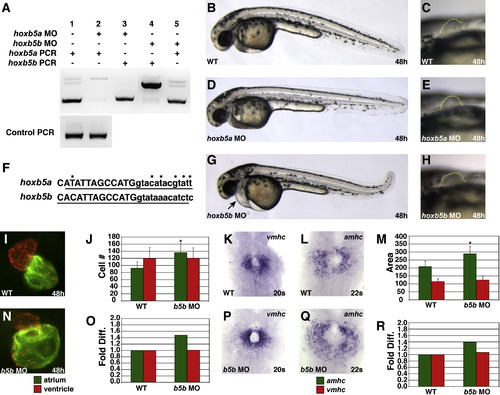
hoxb5b Morphants Display an Increased Number of Atrial Cardiomyocytes (A) MOs targeting the donor site of the single intron in either hoxb5a or hoxb5b efficiently abrogate splicing of the respective transcript without affecting the other transcript. Larger bands in lanes 2 and 4 represent the retained introns of hoxb5a and hoxb5b, respectively. (B–E, G, and H) hoxb5a morphants have no evident morphological defects, and hoxb5b morphants exhibit enlarged hearts, pericardial edema, and overtly normal pectoral fins. Lateral views, anterior to the left, 48 hpf, with higher magnification of pectoral fin outlined in (E), (G), and (H). (F) Genomic intron-exon structure is completely conserved and nucleotide sequences are highly conserved in the locations that we targeted with anti-hoxb5b and anti-hoxb5a MOs. Uppercase letters designate first exon sequence, and lowercase letters are intronic sequence. Underline indicates the respective MO target sequences. Asterisks indicate sequence differences. (I–R) hoxb5b morphants display an increased number of atrial cardiomyocytes and a normal number of ventricular cardiomyocytes. Views and graphs are as presented in Figure 1. Error bars represent SD. EXPRESSION / LABELING:
PHENOTYPE:
|

Hoxb5b Acts Nonautonomously to Restrict Atrial Cell Number (A–D) Experimental design for transplantation of WT donor cells into morphant host embryos. (A) WT donor embryos carrying Tg(cmlc2:DsRed2-nuc) were injected with fluorescein dextran at the one-cell stage. (B and C) At sphere stage, donor blastomeres were transplanted into the margin of hoxb5a or hoxb5b morphant host embryos. (D) At 48 hpf, cardiomyocyte progeny of donor-derived cells (arrows) were detected on the basis of their nuclear DsRed localization. Fixation destroys the fluorescence of the fluorescein dextran lineage tracer, allowing for clean visualization of Amhc (green). (E) Example of donor cells (arrows) contributing to both the atrium and the ventricle in a hoxb5a morphant host. (F) Example of donor cells (arrows) contributing to the atrium in a hoxb5b morphant host. (G) Frequency of donor cell contributions to each cardiac chamber in hoxb5a and hoxb5b morphant hosts. (H–K) Experimental design for transplantation of hoxb5b morphant or mRNA-injected donor cells into morphant host embryos. (H) WT donor embryos were injected with hoxb5b MO or hyperactive hoxb5b mRNA along with fluorescein dextran at the one-cell stage. (I and J) At sphere stage, donor blastomeres were transplanted into the margin of hoxb5b morphant host embryos carrying the transgene Tg(cmlc2:DsRed2-nuc). (K) At 48 hpf, we selected host embryos in which donor-derived cells contributed to anterior mesoderm lineages other than the heart and counted the number of cardiomyocytes in each of these hosts. (L and M) Donor-derived cells expressing hyperactive hoxb5b nonautonomously reduce the number of atrial cells in hoxb5b morphant embryos. Asterisks represent statistically significant differences between the pair of values indicated by each bar. Error bars represent SD. (N–P) Model of interactions between the forelimb field and heart field that restrict the number of CPs. (N) RA signaling acts on the forelimb field to promote formation of FPs (blue) and expression of RA-responsive genes, including hoxb5b (yellow oval). This indirectly results in production of two hypothesized repressive signals that limit formation of (1) APs (green) and (2) VPs (red). (O) In the absence of RA signaling, the expanded AP and VP populations occupy the space created by the loss of FPs. (P) Without hoxb5b, hypothesized to regulate repressive signal 1, FPs are intact and still restrict VP formation, but the AP population is expanded. |

The Numbers of atrial and Ventricular Cells Are Increased in raldh2 Morphants and neckless (nls/raldh2) Mutants |
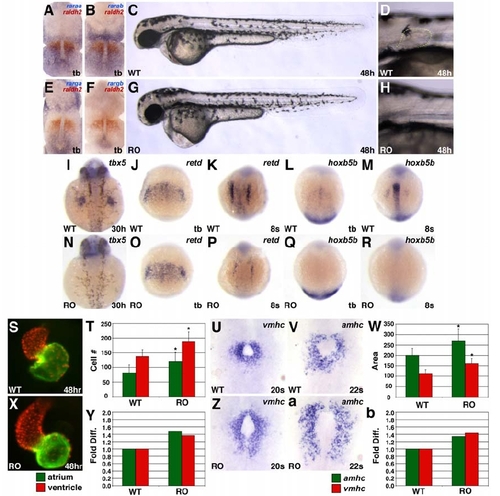
Treatment with the RARα Antagonist Ro41-5253 (Lopez-Boado et al., 1996; Shibakura et al., 1997; Zhang et al., 1995) Phenocopies Treatment with More General Antagonists of RA Signaling, Suggesting that RARα Paralogs Are Required to Promote Forelimb Formation and Limit Cardiac Cell Number |

Fate Map Comparisons Indicate that RA Signaling Limits the Number of Atrial and Ventricular Cardiomyocytes through Independent Mechanisms |

RA Signaling Positively Regulates retd in the LPM |
Comparison of the Expression Patterns of nkx2.5, gata4, retd, hoxb5b, and raldh2 |
Procedure for Fate Mapping at the 8 Somite Stage |
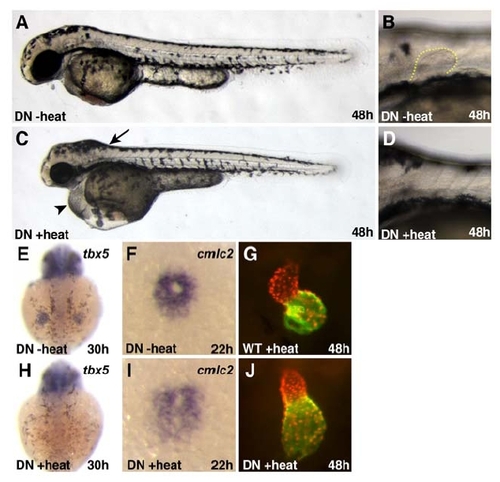
Activation of the Transgene Tg(hsp70:dnRARα) Causes Phenotypes Consistent with a Loss of RA Signaling |

Embryos Injected with hoxb5b RNA or vp16-hoxb5b RNA Display Similar Phenotypes |
Reprinted from Developmental Cell, 15(6), Waxman, J.S., Keegan, B.R., Roberts, R.W., Poss, K.D., and Yelon, D., Hoxb5b acts downstream of retinoic Acid signaling in the forelimb field to restrict heart field potential in zebrafish, 923-934, Copyright (2008) with permission from Elsevier. Full text @ Dev. Cell