
- Title
-
hgf/c-met expression and functional analysis during zebrafish embryogenesis
- Authors
- Latimer, A.J., and Jessen, J.R.
- Source
- Full text @ Dev. Dyn.
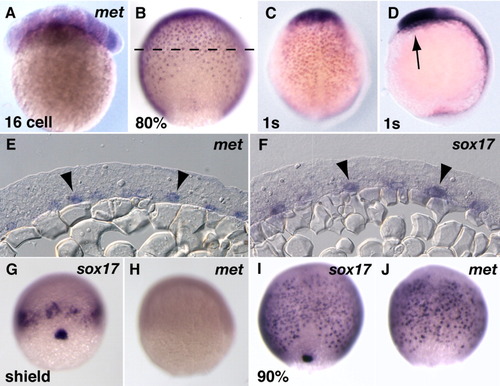
c-met expression in early endodermal cells. A: Whole-mount embryo (1.5 hr, 16 cell-stage) probed for c-met transcripts. The animal pole is to the top. B,C: Whole-mount, dorsal views at (B) 9 hr (80% epiboly) and (C) 10.5 hr (1 somite-stage) showing expression in presumptive endodermal cells. D: Lateral view at 10.5 hr showing additional expression in the anterior neuroectoderm (arrow). E,F: Transverse sections of 9-hr embryos (approximately at the plane of the dashed line in B) showing c-met (E) and sox17 expression (F) in presumptive endodermal cells (arrowheads). G-J: Whole-mount, dorsal views of stage-matched embryos from the same clutch probed for sox17 and c-met. The animal pole is to the top. G: sox17 expression in mesendodermal cells near the blastoderm margin and in forerunner cells at 6 hr (shield-stage). H: c-met expression is not visible at the same stage. I,J: c-met and sox17 expression in presumptive endodermal cells at 8.5 hr (late gastrulation). EXPRESSION / LABELING:
|
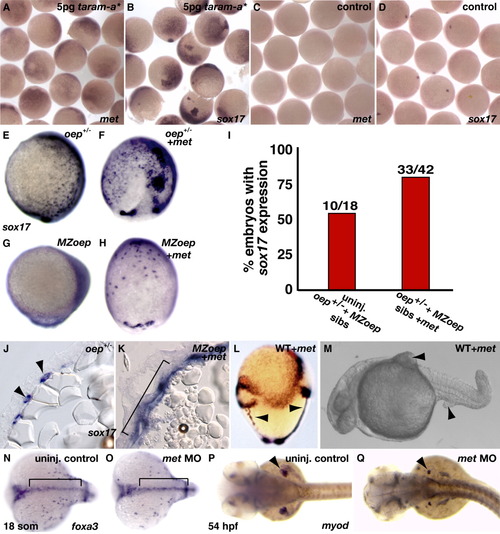
Nodal signaling induces c-met expression and Met promotes endoderm formation. A-D: sox17 and c-met expression in representative groups of embryos injected mosaically with 5 pg taram-a* mRNA (A,B) and control uninjected embryos stained for the same amount of time (C,D). E,G: Lateral views (anterior to the top and dorsal to the right) of uninjected oep+/- and MZoep-/- controls labeled with sox17. F,H: Dorsal views (anterior to the top) of oep+/- and MZoep-/- embryos injected with 100 pg c-met mRNA and labeled with sox17. I: Quantification of the numbers of sox17-expressing uninjected and c-met mRNA-injected oep+/- and MZoep-/- siblings. J,K: Transverse sections of uninjected oep+/- and 100 pg c-met mRNA injected MZoep-/- late gastrula-stage embryos labeled with sox17 (J, arrowheads denote endodermal cells; K, bracket denotes expanded sox17 expression). L: Lateral view (anterior to the top) of a wild-type embryo injected with 100 pg of c-met mRNA and probed for hgg1, pax2a, dlx3, and shh expression (arrowheads mark two embryonic axes; the original axis is to the right). M: Ventrolateral view of a live 24-hr embryo injected with 100 pg of c-met mRNA. Hyperplastic growths are visible ventral to the yolk tube extension and on the lateral part of the yolk ball (arrowheads). N,O: Eighteen-hour (18 somite-stage) uninjected control and c-met AUG MO-injected embryos, dorsal views, showing normal foxa3 expression in medially migrated endodermal precursor cells (brackets). P,Q: Uninjected control and c-met AUG MO-injected embryos showing dorsal views of 54-hr embryos depicting myod expression in the fin buds (arrowheads). EXPRESSION / LABELING:
PHENOTYPE:
|
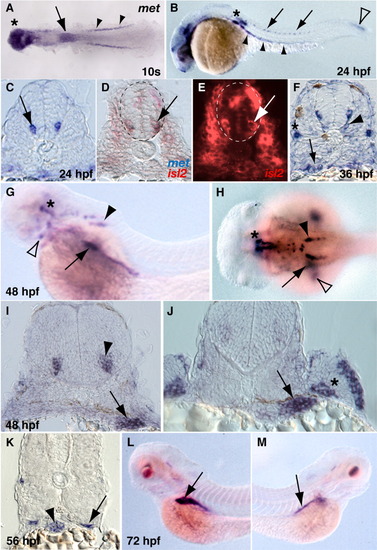
c-met expression from somitogenesis-stages through 72 hr. A: Flat-mounted embryo at 14 hr (10 somite-stage), anterior is to the left. Note expression in the pronephric ducts (arrowheads), presumptive forebrain (asterisk), and anterior spinal cord (arrow). B: Whole-mount, lateral view showing c-met in neural tube cells (arrows), pronephric ducts (arrowheads), posterior lateral line primordium (asterisk), and posterior spinal cord (open arrowhead). C-F: Transverse sections through the trunk, dorsal is to the top. C: c-met expression in neural tube (arrow) at 24 hr. D,E: c-met in blue and isl2 in red. The same cell (arrows) is labeled by each probe. F: c-met expression in the pronephric ducts (arrow) and cells adjacent to the ventral neural tube (arrowhead) at 36 hr. The asterisk denotes lateral line expression. G: Forty-eight-hour, whole-mount, lateral view showing c-met in the fin bud and liver (arrow), hindbrain (black arrowhead), diencephalon (asterisk), and parathyroid (open arrowhead). H: Forty-eight-hour, whole-mount, dorsal view showing expression in the hindbrain (black arrowhead), liver (arrow), diencephalon (asterisk), and fin bud (open arrowhead). I: Forty-eight-hour transverse section showing c-met in the liver (arrow) and hindbrain (arrowhead). J: Transverse section at a slightly more posterior level than I showing expression in the liver (arrow) and fin bud (asterisk). K: Fifty-six-hour transverse section, further posterior than sections in I and J, showing c-met in the pronephric ducts (arrow) and gut (arrowhead). Lateral views of c-met expression in the liver (L) and pancreas (M) of a 72-hr embryo. Embryos in G, H, L, and M were treated with PTU to reduce pigment. EXPRESSION / LABELING:
|
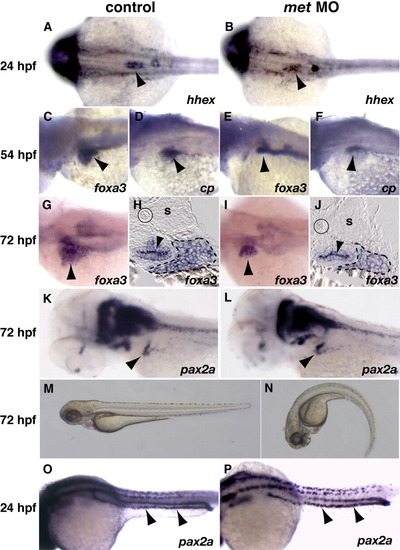
Knockdown of Met function causes reduced liver size and a ventrally curved body axis. Control uninjected (A,C,D,G,H,K,M,O) and c-met AUG antisense MO injected (B,E,F,I,J,L,N,P) embryos. A,B: Dorsal views showing hhex expression in the liver primordium at 24 hr (arrowheads). C-F: Dorsolateral, left-sided views of 54-hr whole-mount embryos labeled with foxa3 and cp. Liver primordia are indicated by black arrowheads. G,I: Whole-mount embryos, dorsolateral views, showing liver foxa3 expression at 72 hr. H,J: Transverse sections of 72-hr embryos at approximately the same longitudinal plane showing foxa3 expression in the liver (dashed line) and gut (arrowhead). The positions of the notochord (solid black circle) and somite (s) are indicated. K,L: Whole-mount embryos, dorsolateral views, showing pax2a expression at 72 hr. Note that pax2a expression is reduced or absent in the pronephric duct (asterisks) and strongest in the pronephric tubule (arrowheads) by this stage in both uninjected control and MO-injected embryos. M,N: Lateral views of live 72-hr embryos. O,P: Pronephric tubule specification visualized by pax2a expression at 24 hr (arrowheads). Embryos in C-F and K and L were treated with PTU to reduce pigment. EXPRESSION / LABELING:
PHENOTYPE:
|
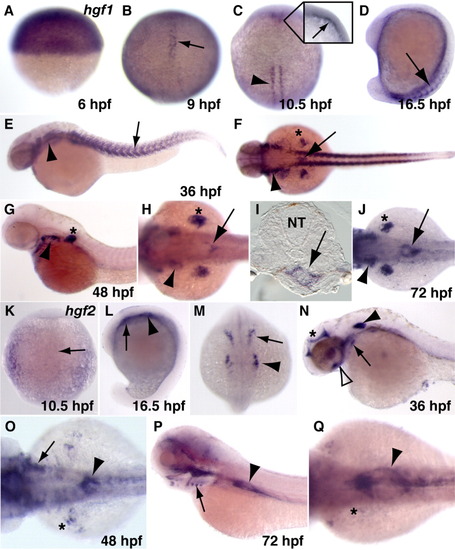
hgf1 and hgf2 expression from the onset of gastrulation through 72 hr. A-C: Whole-mount, dorsal views of embryos probed for hgf1 expression. The animal pole is to the top. A: Shield-stage (6 hr). B: Ninety percent epiboly (9 hr) embryos express hgf1 in a subset of dorsal cells (arrow). C: By 10.5 hr (1 somite-stage), adaxial cells express hgf1 (arrowhead) as well as deep anterior cells (inset, arrow). D: Whole-mount lateral view at 16.5 hr (15 somite-stage) showing hgf1 expression in the somites (arrow). E,F: Whole-mount, 36-hr embryos. E: hgf1 expression in the pharyngeal arches (arrowhead) and somites (arrow) is visible in lateral view. F: Dorsal view showing pharyngeal arch (arrowhead) and early swim bladder hgf1 expression (arrow). Fin bud expression (asterisk) is visible just posterior to the arches. G-I: Forty-eight hours. G: Lateral view showing pharyngeal arch (arrowhead) and fin bud (asterisk) hgf1 expression. H: Dorsal view showing pharyngeal arch (arrowhead), swim bladder (arrow), and fin bud (asterisk) hgf1 expression. I: Transverse section at the level of the swim bladder showing hgf1 expression in cells surrounding the swim bladder (arrow). The neural tube (NT) is marked for reference. J: Whole-mount dorsal view at 72 hr showing pharyngeal arch (arrowhead), fin bud (asterisk), and swim bladder (arrow) hgf1 expression. Note lack of liver staining near the left fin bud. K: Whole-mount, dorsal view at 10.5 hr (1 somite-stage) showing lack of hgf2 expression at this stage (embryo has been overstained). The embryonic midline is marked with an arrow. L,M: Embryos (16.5 hr, 15 somite-stage) showing hgf2 expression in lateral (L) and dorsal views (M). Pharyngeal arch (arrows) and otic vesicle (arrowheads) expression is visible at this stage. Note lack of somite expression. N: Thirty-six-hour lateral view depicting hgf2 expression in the otic vesicle (arrowhead), pharyngeal arches (arrow), brain ventricles (asterisk), and surrounding the eye (open arrowhead). O: Dorsal view showing 48-hr hgf2 expression in the pharyngeal arches (arrow) and swim bladder (arrowhead). Note weak hgf2 expression in the fin bud (asterisk). P: Later view showing 72-hr hgf2 expression in the pharyngeal arches (arrow) and swim bladder (arrowhead). Q: Seventy-two-hour dorsal view showing swim bladder hgf2 expression (arrowhead) and lack of detectable hgf2 expression near the liver (asterisk). This embryo was cleared in methanol for an extended period so that specific staining could be better visualized. Embryos in E-J and N-Q were treated with PTU to reduce pigment. EXPRESSION / LABELING:
|

Unillustrated author statements EXPRESSION / LABELING:
PHENOTYPE:
|