
- Title
-
Endothelial Signals Modulate Hepatocyte Apicobasal Polarization in Zebrafish
- Authors
- Sakaguchi, T.F., Sadler, K.C., Crosnier, C., and Stainier, D.Y.
- Source
- Full text @ Curr. Biol.
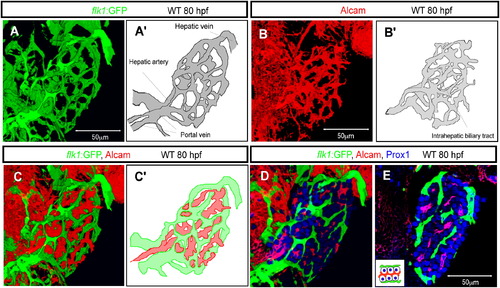
The Vascular and Biliary Networks in the Developing Zebrafish Liver (A and A′) Projected confocal image of Tg(flk1:EGFP)s843 expression in the liver at 80 hpf. The intrahepatic vascular network visualized by Tg(flk1:EGFP)s843 expression is schematically presented in (A′). (B and B′) Projected confocal image of Alcam expression at 80 hpf. The intrahepatic biliary network visualized by Alcam staining is schematically presented in (B′). (C and C′) Merged image of Tg(flk1:EGFP)s843 (green) and Alcam (red) expression shows that the intrahepatic vascular and biliary networks always maintain a certain distance between each other. The intrahepatic vascular (green) and biliary (red) networks are schematically represented in (C′). (D and E) Projected confocal image (D) and z-plane confocal image (E) of Tg(flk1:EGFP)s843 larvae visualized for GFP (green), Prox1 (blue), and Alcam (red) expression. Monolayers of hepatocytes separate the vascular and biliary networks, as illustrated in the inset. EXPRESSION / LABELING:
|

Coordinated Development of the Intrahepatic Vascular and Biliary Networks Projected (A–D) and z-plane (E–H) confocal images of the liver at 50 (A and F), 55 (B and G), 60 (C and H), and 80 (D and I) hpf. The images present ventral views, anterior to the top. (A–D) Tg(flk1:EGFP)s843 larvae visualized for GFP (green) and Prox1 (blue) expression. (A) By 50 hpf, endothelial cells have established contact with the liver on its dorsolateral side (as indicated by the arrow). (B) By 55 hpf, endothelial cells have surrounded the liver. (C) By 60 hpf, endothelial cells have started to invade the liver (as indicated by white arrowheads). (D) By 80 hpf, the endothelial cells have formed a highly branched network in the liver. (E–H) Tg(flk1:EGFP)s843 larvae visualized for GFP (green), Prox1 (blue), and Alcam (red). The outlined areas are magnified and shown in bottom corners. (E′–H′) Alcam immunostainings are shown separately. By 60 hpf, Alcam expression has become restricted to the cell membrane opposite to the one contacted by endothelial cells (as indicated by white arrowheads), whereas it is still localized along the entire cell membrane of cells (as indicated by the black arrowhead) located far from the invading endothelial cells. L, liver; P, pancreas. EXPRESSION / LABELING:
|
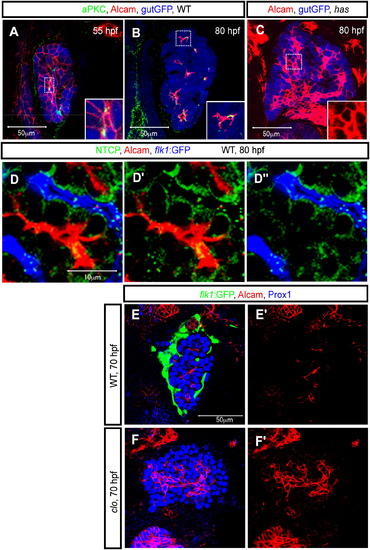
Alcam Localizes to the Apical Membranes of Hepatocytes Z-plane confocal images of the liver at 55 (A), 70 (E and F), and 80 (B–D) hpf. The images present ventral views, anterior to the top. (A and B) Wild-type Tg(gutGFP)s854 larvae visualized for GFP (pseudocolored blue), Alcam (red), and aPKCs (pseudocolored green) expression. The outlined areas in (A) and (B) are magnified and shown in bottom right corners. At 55 hpf, aPKCs show restricted expression in hepatocytes prior to Alcam restriction. Alcam and aPKCs colocalize more extensively at 80 hpf. (C) Tg(gutGFP)s854 heart and soulm567 (has) /prkci mutant larvae visualized for GFP (pseudocolored blue) and Alcam expression at 80 hpf. The Alcam staining of the outlined area is magnified and shown in the bottom right corner. At 80 hpf, whereas Alcam localization is restricted to the apical membrane of hepatocytes in wild-type larvae, in has m567 mutants, it is still localized along the entire cell membrane of most cells. (D) Tg(flk1:EGFP)s843 larvae visualized for GFP (pseudocolored blue), Alcam (red), and Ntcp (green) expression. Alcam and Ntcp immunostainings are shown separately in (D′). Alcam and Tg(flk1:EGFP)s843 expressions are shown separately in (D″). (E and F) Wild-type (E) and clochela1164 (clo) mutant (F) larvae visualized for Tg(flk1:EGFP)s843 (green), Alcam (red), and Prox1 (blue) expression at 70 hpf. At this stage, whereas Alcam has localized to the apical membranes of most cells in wild-type livers, it is still localized along the entire cell membrane of many cells in clo la1164 mutant livers. EXPRESSION / LABELING:
|

Endothelial Cells Can Influence Alcam Subcellular Localization (A–D) Tg(flk1:EGFP)s843 larvae treated with the VEGF-receptor inhibitor SU5416 from 55 to 80 hpf were visualized for GFP (green), Alcam (red), and Prox1 (blue) expression at 80 hpf. (A) Projected confocal image of Tg(flk1:EGFP)s843 expression in the liver of an SU5416-treated larva in which the intrahepatic vascular network (schematically presented in [A′]) is disrupted and endothelial cells have formed a dead-end vascular branch (indicated by arrow). (B) Projected confocal image of the same liver visualized for Alcam expression at 80 hpf. The pattern of the Alcam-positive network (schematically presented in [B′]) reflects the disrupted intrahepatic vascular network. (C) Merged image of Alcam (red) and Tg(flk1:EGFP)s843 (green) expression shows that the intrahepatic networks still do not intersect. (D) Z-plane confocal image of the same larva. Alcam (indicated by white arrowheads) accumulates on membranes away from the dead-end vascular branch (indicated by arrow). The outlined area is magnified and shown in (D′). Alcam immunostaining in (D′) is shown separately in (D″). (E–I) Tg(flk1:EGFP)s843 larva containing vegf121 mRNA-overexpressing cells visualized for GFP (green), Alcam (pseudocolored red), and donor cell tracer (rhodamine dextran; pseudocolored white) at 80 hpf. (E) Projected confocal image of Tg(flk1:EGFP)s843 expression in the liver. The transplanted vegf121 mRNA-overexpressing cells (indicated by black arrowheads) disrupt the intrahepatic vascular network (schematically presented in [E′]). (F) Projected confocal image of the same liver visualized for Alcam expression at 80 hpf. The pattern of the Alcam-positive network (schematically presented in [F′]) reflects the disrupted intrahepatic vascular network. (G) Merged image of Alcam (red) and Tg(flk1:EGFP)s843 (green) expression shows that the intrahepatic vascular networks still do not intersect. (H) Z-plane confocal image of the same larva. The outlined area is magnified and shown in (I). EXPRESSION / LABELING:
|
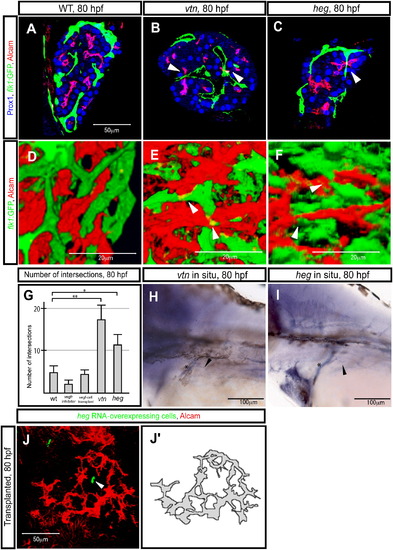
The heart of glass Gene Regulates Hepatocyte Polarization (A–F) Tg(flk1:EGFP)s843 wild-type (A and D), valentines259 (vtn) mutant (B and E), and heart of glassm552 (heg) mutant (C and F) larvae, visualized for GFP (green), Prox1 (blue), and Alcam (red) expression. Z-plane (A–C) and projected (D–F) confocal images of the liver at 80 hpf. (A and D) In wild-type larvae, the vascular network marked by Tg(flk1:EGFP)s843 expression and the biliary network marked by Alcam expression maintain a certain distance from each other and usually do not intersect. (B and E) In vtn s259 mutants, the intrahepatic vascular and biliary networks frequently intersect (as indicated by arrowheads). (C) In heg m552 mutants, the phenotype is similar to that of vtns259 mutants, but milder; the intrahepatic vascular and biliary networks occasionally intersect (as indicated by arrowheads). (G) Number of intersections between the intrahepatic vascular and biliary networks in wild-type, Vegf-receptor-inhibitor-treated, vegf121 mRNA-overexpressing cell hosts, vtn s259 mutants, and heg m552 mutants at 80 hpf. The error bars represent standard deviations. (H and I) vtn (H) and heg (I) expression in 80 hpf wild-type larvae. The images show lateral views, anterior to the left. Both genes appear to be expressed in endothelial cells. Asterisks indicate the common cardinal vein. Black arrowheads point to the intrahepatic vascular network. (J) Projected confocal image of the liver at 80 hpf. Larva transplanted with heg mRNA-overexpressing cells in the endoderm visualized for Alcam (pseudocolored red) and rhodamine dextran (donor cell marker; pseudocolored green). The arrowhead points to the transplanted heg mRNA-overexpressing cells inside the liver. Alcam appears to accumulate away from the heg mRNA-overexpressing cells. Alcam-expression pattern is schematically presented in (J′). EXPRESSION / LABELING:
PHENOTYPE:
|
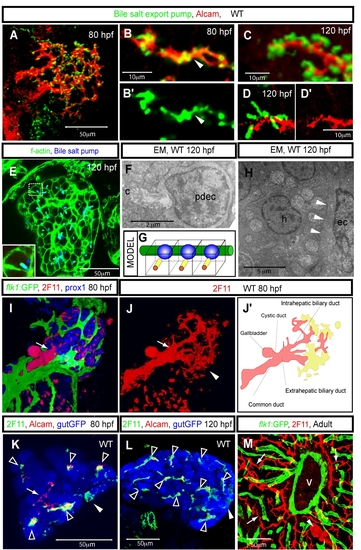
The biliary system in zebrafish. (A-G) The intrahepatic biliary network and bile canaliculi. Projected (A and C) and z-plane (B, D and E) confocal images of wild-type livers visualized for Alcam (red) and the canalicular marker Abcb11 (Bile salt export pump; green) at 80 (A and B) and 120 (C and E) hpf. Abcb11 immunostaining is shown separately in B′. Alcam immunostaining is shown separately in D′. (A) Alcam and Abcb11 co-staining reveals the intrahepatic biliary network and bile canaliculi at 80 hpf. (B) Alcam and Abcb11 immunostaining mostly overlap at 80 hpf (arrowhead). (C-D) The overlap between Alcam and Abcb11 immunostaining becomes restricted to the outer edge of the canaliculi by 120 hpf. (E) Z-plane confocal image of a 120 hpf liver visualized for F-actin (green) and Abcb11 (blue) expression. The outlined area is magnified and shown in bottom left corner. (F) Electron micrograph of a canaliculus (c) at 120 hpf, showing microvilli in the canaliculus. pdec, preductule biliary epithelial cell. (G) Schematic representation of the canaliculi in the zebrafish liver. Canaliculi (yellow rods) appear as tubular invaginations of the hepatocyte apical membranes. The vascular network (green) lines the basal side of the hepatocytes, nuclei are shown in blue. (H) Electron micrograph of the liver at 120 hpf. White arrowheads point to the border between a hepatocyte (h) and endothelial cell (ec). (I) Projected confocal images of Tg(flk1:EGFP)s843 larvae visualized for GFP (green), 2F11(red) and Prox1 (blue) expression at 80 hpf. The border between the intra and extra-hepatic biliary duct is indicated by an arrow. (J) Projected confocal image of the liver visualized by mAb 2F11 staining at 80 hpf. The common bile duct, gallbladder and extrahepatic and intrahepatic biliary ducts, which are visualized by mAb 2F11 staining, are schematically presented in J′. mAb 2F11 also stains cells in the periphery of the liver (arrowhead in J, yellow region in J′). Note that at this stage, 2F11 stains fewer branches of the intrahepatic biliary network than Alcam does. (K and L) Z-plane confocal image of a Tg(gutGFP)s854 liver visualized for GFP (pseudo-colored blue), Alcam (red) and 2F11 (pseudo-colored green) expression at 80 (K) and 120 (L) hpf. Alcam and 2F11 immunostainings mostly overlap in the liver (black arrowheads), however some intrahepatic ducts express Alcam but not the 2F11 antigen (white arrow) at 80 hpf. mAb 2F11 also stains cells in the periphery of the liver (white arrowheads). All confocal images of larval livers are ventral views, anterior to the top. (M) The biliary system in the adult zebrafish liver. The liver of a Tg(flk1:EGFP)s843 fish visualized for GFP (green) and 2F11 antigen (red) expression. The 2F11 antigen is expressed by all biliary epithelial cells, and it reveals the bile duct (arrowhead) and the preductule biliary epithelial cells (arrow). v, a major blood vessel in the liver. |
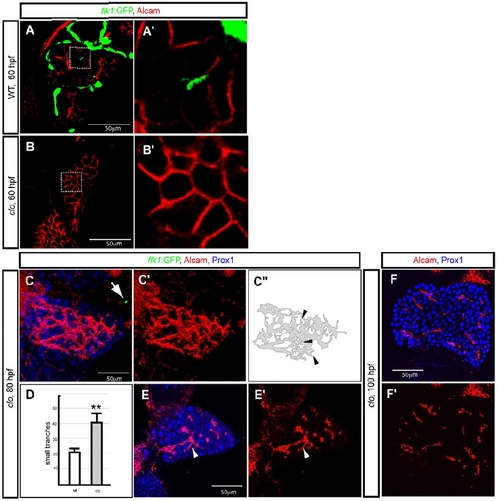
Defective hepatocyte polarization in cloche mutant larvae. (A, B) Wild-type (A) and clochela1164 (clo) mutant (B) larvae visualized for Tg(flk1:EGFP)s843 (green) and Alcam (red) expression at 60 hpf. The outlined areas are magnified and shown in A′ and B′. (C) Projected confocal image of a clochem378 (clo) mutant larva visualized for Tg(flk1:EGFP)s843 (green), Alcam (red) and Prox1 (blue) expression at 80 hpf. There are almost no endothelial cells in the trunk of clom378 mutant larvae, but occasionally a few Tg(flk1:EGFP)s843 positive cells are present (arrow). Alcam immunostaining is shown separately in C′ and is schematically presented in C″. It appears to exhibit extra small branches (arrowheads) compared to wild-type (Fig. 1B). (D) Number of small branches of the Alcam positive network in wild-type (average 22 branches per liver, n = 3, SD= 2.6) and cloche mutant (average 42 branches per liver, n= 4, SD = 5.7) livers at 80 hpf is shown in white and grey, respectively. (E) z-plane confocal images of the same clom378 mutant larva visualized for Prox1 (blue) and Alcam (red) expression. Alcam immunostaining is shown separately in E′. White arrowhead points to one of the small branches. (F) z-plane confocal images of a clom378 mutant larva visualized for Prox1 (blue) and Alcam (red) expression at 100 hpf. Alcam immunostaining is shown separately in F′. |

The intrahepatic vascular and biliary networks in Vegf receptor inhibitor treated larvae. (A-F) Two examples (A-C and D-F) of Tg(flk1:EGFP)s843 larvae treated with the Vegf receptor inhibitor SU5416 from 55 to 80 hpf. The larvae were visualized for GFP (green), Alcam (red) and Prox1 (blue) expression at 80 hpf. (A and D) Projected confocal images of Tg(flk1:EGFP)s843 expression in the liver of a SU5416 treated larva in which the intrahepatic vascular network (schematically presented in A′ and D′) is disrupted compared to wild-type (Fig. 1A). (B and E) Projected confocal images of the liver visualized for Alcam expression at 80 hpf. The pattern of the Alcam positive network (schematically presented in B′ and E′) reflects the disrupted intrahepatic vascular network. (C and F) Merged images of Tg(flk1:EGFP)s843 (green) and Alcam (red) expression shows that the disrupted intrahepatic networks still do not intersect. |
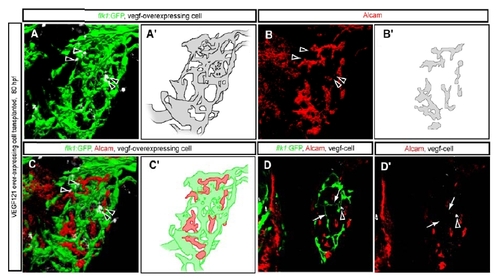
The intrahepatic vascular and biliary networks in larvae containing vegf121 mRNA over-expressing cells in their liver. Tg(flk1:EGFP)s843 larva containing vegf121 mRNA over-expressing cells visualized for GFP (green), Alcam (pseudo-colored red) and donor cell tracer (rhodamine dextran; pseudo-colored white) at 80 hpf. (A) In this transplanted larva, 4 donor cells (arrowheads) located inside the liver disrupt the intrahepatic vascular network (schematically presented in A′). (B) Projected confocal image of the same liver visualized for Alcam expression at 80 hpf. The pattern of the Alcam positive network (schematically presented in B′) reflects the disrupted intrahepatic vascular network. (C) Merged image of Alcam (red) and Tg(flk1r:EGFP)s843 (green) expression shows that the intrahepatic networks still do not intersect. (D) z-plane confocal image of the same larva. Alcam expression and rhodamine dextran are shown separately in D′. Endothelial cells have formed extra vessels (arrows in D and D′) near the vegf121 mRNA over-expressing cells. |

Extracellular matrix protein deposition in the developing liver. (A and B) z-plane confocal images of a Tg(gutGFP)s854 larva visualized for GFP (pseudo-colored blue) and Lama1 (Laminin alpha 1; red) expression at 55 (A) and 80 (B) hpf. Lama1 immunostaining is shown separately in A′ and B′. Endothelial cells contacting the anterior side of the liver appeared to be surrounded by Lama1 expression (asterisk) at 55 hpf. Lama1 is strongly deposited around the extrahepatic biliary duct (arrow), but not significantly inside the liver at 80 hpf. However, it is worth noting that Lama1 is not the major laminin isoform expressed by endothelial cells26. (C) z-plane confocal image of Tg(flk1:EGFP)s843 liver visualized for GFP (green), F-actin (blue) and Collagen IV (red) at 80 hpf. Collagen IV immunostaining in the outlined area is shown separately in bottom right corner. No Collagen IV immunostaining is detected in the liver. (D) z-plane confocal image of the dorsal aorta and intersomitic vessels of a Tg(flk1:EGFP)s843 larva. The larva was visualized for GFP (green) and Collagen IV (red) expression at 80 hpf. Collagen IV immunostaining is shown separately in D′. Collagen IV surrounds the dorsal aorta and intersomitic vessels. (E) z-plane confocal image of a Tg(flk1:EGFP)s843 larva visualized for GFP (green), F-actin (blue) and Fibronectin (red) at 80 hpf. Fibronectin immunostaining is shown separately in E′. Fibronectin deposition is detected in, or around, the intrahepatic biliary network (black arrowheads). L, liver; I, intestine. |

Intersection of the intrahepatic vascular and biliary networks in valentine (vtn) and heart of glass (heg) mutant larvae. Tg(flk1:EGFP)s843 wild-type (A), vtns259 mutant (B) and hegm552 mutant (C) larvae visualized for GFP (pseudo-colored white), Alcam (red) and Ntcp (green) expression. Alcam and Ntcp immunostainings are shown separately in A′, B′ and C′. In wild-type livers, endothelial cells always line the basal membrane of hepatocytes. However in the vtn and heg mutant livers, endothelial cells sometimes contact the apical membranes of hepatocytes. Arrowheads point to intersections between endothelial cells and the Alcam positive network. |

vtn and heg expression in the liver. (A, B) Higher magnification views of vtn (A) and heg (B) expression in 80 hpf wild-type larvae. Lateral views, anterior to the left. Black dots outline the position of the liver. Both genes are expressed in the common cardinal vein and this expression pattern is continuous with the hepatic vein and intrahepatic vascular network. Thus, both genes appear to be expressed in endothelial cells in the liver. CCV, common cardinal vein. |