
- Title
-
A non-canonical function of zebrafish telomerase reverse transcriptase is required for developmental hematopoiesis
- Authors
- Imamura, S., Uchiyama, J., Koshimizu, E., Hanai, J., Raftopoulou, C., Murphey, R.D., Bayliss, P.E., Imai, Y., Burns, C.E., Masutomi, K., Gagos, S., Zon, L.I., Roberts, T.M., and Kishi, S.
- Source
- Full text @ PLoS One
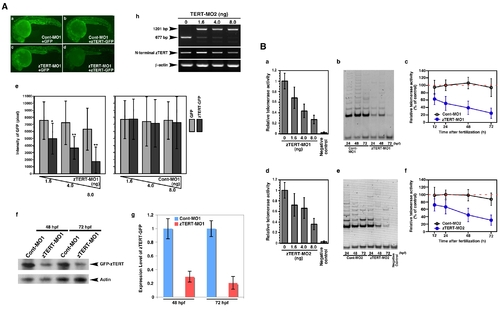
The knockdown of TERT in the zebrafish embryo does not result in telomere shortening. (A) A zTERT-MO1-induced translational block was monitored using mini-zTERT-GFP (zTERT-GFP) in vivo. To test the effectiveness of the MO1 in binding the transcript and inhibiting downstream translation, a GFP reporter construct driven by a DNA sequence upstream from the zTERT coding region (encompassing the zTERT-MO1 target region) was used. Representative GFP expression profiles are shown for embryos (24 hpf) injected with Cont-MO1 and GFP empty vector (a), Cont-MO1 and zTERT-GFP (b), zTERT-MO1 and GFP empty vector (c), and zTERT-MO1 and zTERT-GFP (d). (e) Quantification of the GFP intensity in embryos injected with a combination of MOs (Cont-MO1 or zTERT-MO1) and plasmids (GFP or zTERT-GFP) as shown in Figure 1A. Five independent experiments incorporating more than 50 embryos in each instance were performed. *P<0.01, **P<0.001, (Student t-test). (f) Western blot analysis using an anti-GFP antibody to detect the expression of zTERT-GFP, and its reduction by zTERT-MO1 but not Cont-MO1. (g) For the western blotting results, the intensities of the bands were quantitated using the associated pixel levels and the expression levels of GFP-zTERT were normalized to actin in each time point as a ratio of mean values which are shown in the right side graphs. These experiments were independently performed three times. P<0.001 (Student t-test). (h) RT-PCR analysis of zTERT MO2-induced altered splicing of zTERT transcripts. The 677 bp intact zTERT transcript was detectable in uninjected embryo samples (0 ng), and to some degree in the 1.6 and 4.0 ng injected samples. A 1201 bp product indicating the insertion of an intact intron between exons 5 and 6 was almost predominantly observed in samples injected with 8 ng MO2 (48 hpf). In contrast, the 677 bp intact band was almost undetectable in these same morphants. (B) Quantitative analysis of telomerase activity in zTERT knockdown embryos injected with 1.6 to 8.0 ng MO1 and MO2 during 12–72 hpf. (a, d) A TRAP-ELISA assay was performed in zTERT knockdown embryos injected with 1.6, 4.0, and 8.0 ng MO1 (a) or MO2 (d). (b, e) TRAP assay using electrophoretic gel analysis over a 24–72 hpf timecourse for MO1 (b) or MO2 (d). (c, f) Quantitative fluorometric TRAP assay performed over a 12–72 hpf timecourse for MO1 (c) or MO2 (f). PHENOTYPE:
|

The knockdown of TERT in the zebrafish embryo results in severe cytopenia and in the impaired differentiation of hematopoietic cells. (A) Induction of apoptosis in hematopoietic cells of the zebrafish embryo. Both a low magnification of the whole body and higher magnification of the trunk region are shown in (a) and (c), respectively. White squares in the low magnification images designate the regions shown in the higher magnification images in the adjoining right panels. (a) Apoptotic cells were detected by a TUNEL assay of the ventral wall of the dorsal aorta (VW-DA) (shown by green arrow heads in the right panel) at 28 hpf. (b) Quantification of the TUNEL-positive cells in the ventral wall of dorsal aorta (VW-DA) at 28 hpf. The number of TUNEL-positive cells was estimated within the gated area indicated by the green dashed rectangle at the upper yolk extension. (c) Apoptotic cells were detected by a TUNEL assay of the caudal venous plexus (CVP) (shown by green arrow heads in the right panel) at 48 hpf. (d) Quantification of the TUNEL-positive cells detected in the CVP at 48 hpf. The quantity of TUNEL-positive cells was assessed.within the gated area indicated by the green dashed rectangle at the anatomical CVP region. (e) Detection of apoptosis in gata-1GFP-positive hematopoietic cells. Transverse sections through the trunk region of 48-hpf gata-1GFP embryos with the dorsal up are shown. The caudal artery (CA; upper) and caudal vein (CV; lower) are shown by orange arrow heads in the panels. By TUNEL assay, gata-1GFP-positive apoptotic cells in the CV are evident and indicated by white arrows. (B) Lateral views of 48, 72 and 120 hpf embryos following the co-injection of zTERT-MO1 (or Cont-MO1) and GFP-zTERT-cDNA (or GFP-cDNA) expression vectors (a–l); black arrowheads indicate the heart regions. Bright field pictures of blood cells in trunks of 72 hpf embryos after co-injection of zTERT-MO1 or Cont-MO1 and either a GFP-cDNA or GFP-zTERT-cDNA vector (m–p). The upper vessel is the dorsal artery (from left to right arrows) and the lower vessel is the posterior cardinal vein (from right to left arrows). (C) Quantitation of the circulating blood cell number in zTERT-MO- (blue circle) versus Cont-MO- (black open circle) injected embryos during 28–72 hpf (a). (b) Calculation of the percentage of the control circulating blood cell numbers at 72 hpf after co-injection of zTERT-MO or Cont-MO and either a GFP-control or GFP-zTERT-cDNA vector. Blood cell numbers were determined for 10 embryos from each group. (D) Whole-mount o-dianisidine staining for heme detection in uninjected, Cont-MO1- and zTERT-MO1-injected embryos during 32–168 hpf. Blood flow over the yolk sac and in the tail vessels results in brown staining in wild type (data not shown) and Cont-MO1-injected embryos during 32–168 hpf (ventral view). (E) H&E staining of blood cells in tissue sections of the arteries or veins of Cont-MO1- and TERT-MO1-injected embryos at 33 and 48 hpf, and Wright-Giemsa staining of isolated blood cells from Cont-MO1- and TERT-MO1-injected embryos at 48 hpf. EXPRESSION / LABELING:
PHENOTYPE:
|

TERT is required for both primitive and definitive hematopoiesis in the zebrafish. Whole-mount in situ hybridization of control and TERT deficient zebrafish embryos at the 20-somite stage (19 hpf) (A), and at 28–32 hpf (B). (A) For the detection of primitive hematopoietic markers, 20-somite stage zebrafish embryos (19 hpf) are shown and are oriented anterior left in lateral (a–f) and dorsal views (a′–d′). Control and TERT morphants were analyzed for the expression of scl, lmo2 and gata-2, which are early hematopoietic markers. The expression of scl and lmo2 in the ICM (a–d, a′–d′), and that of gata-2 in the blood island (e, f), is indicated by arrowheads. (B) Embryos at 28–32 hpf and oriented anterior left in a lateral view and are shown at a low (a–r) and high (a′–r′) magnification of the trunk region. Control and TERT morphants were analyzed for the expression of multiple hematopoietic cell lineage markers. Representative time points for the expression of runx1 (32 hpf), c-myb (32 hpf), alas2 (32 hpf), gata-1 (28 hpf), pu.1 (28 hpf), globin bE3 (28 hpf), l-plastin (28 hpf), mpo (28 hpf), and flk1 (28 hpf) genes are shown. The expression in the arterial region is indicated by arrowheads (a′–n′). EXPRESSION / LABELING:
|
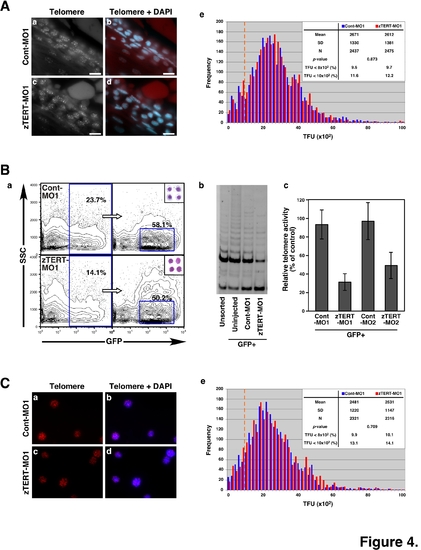
Telomere length and telomerase activity in the blood cells of zebrafish embryos. (A) Telomere length analysis of blood cells in tissue sections from control and TERT morphant embryos by telomere FISH (a, c). The sections were also counterstained with DAPI (b, d). The intensities of the fluorescent speckles detected with a telomere PNA probe reflect the corresponding telomere lengths (a, c; grayscale; bar, 10 μm). Nuclei were counterstained with DAPI and merged with telomere spots on the captured images (b, d; bar, 10 μm). (e) Q-FISH histograms showing telomere fluorescence in blood cell nuclei from control (the blue color bars) and TERT morphants (the red color bars), as measured using the TFL-TELO software. The x-axis depicts the intensity of each signal as expressed in telomere fluorescence intensity units (TFU), and the y-axis shows the frequency of telomeres of a given intensity. The dashed orange line indicates 10x102 TFU. (B) Zebrafish erythroid cells were isolated from gata-1-promoter-driven GFP (gata-1GFP) transgenic fish by FACS (a). TRAP assay of telomerase activity in gata-1GFP-positive blood cells (b). Quantification of telomerase activity by captured image analyses in GFP-positive cells from the MO1- and MO2-injected samples (c). The activity in GFP-positive cells from uninjected samples was used as a control. (C) Telomere length analysis of gata-1GFP-positive blood cells from control and TERT morphant embryos by telomere FISH (a, c). The intensities of the fluorescent speckles detected with a telomere PNA probe reflect the corresponding telomere lengths. Nuclei were counterstained with DAPI and merged with telomere spots on the captured images (b, d; bar). (e) Q-FISH histograms showing telomere fluorescence in blood cell nuclei from control (the blue color bars) and TERT morphants (the red color bars), as measured using the TFL-TELO software. The x-axis depicts the intensity of each signal as expressed in telomere fluorescence intensity units (TFU), and the y-axis shows the frequency of telomeres of a given intensity. The dashed orange line indicates 10x102 TFU. |

Rescue of cytopenia, but not anemia, in zTERT morphant embryos with a p53-deficient background. (A) Lateral views (anterior to left) of wild-type (p53+/+) and homozygous p53M214K mutant (p53m/m) embryos injected with TERT-MO1 (a–d). Arrowheads indicate the heart regions, including the blood (a′–d′) and views of the artery and veins (anterior to left) in the trunk at 72 hpf. (B) Scoring system based on the number of circulating blood cells at 72 hpf after injection of zTERT-MO1 or Cont-MO1 into p53+/+ and p53m/m embryos. We divided the embryos into three classes based on their flowing blood cell number: i) indistinguishable from the control (>90%; no change) as indicated by the gray bar, ii) cell number reduction compared with the control (10–90%; reduction) as indicated by the light-blue bar, and iii) severely deficient or almost no flowing blood cells (<10%; deficiency) as indicated by the dark-blue bar. (C) Percentages of the control levels of circulating blood cell numbers at 72 hpf after the injection of zTERT-MO1 or Cont-MO1 into p53+/+ and p53m/m embryos. Blood cell numbers were counted in 10 embryos from each group. *P<0.01 (Student t-test). (D) Whole-mount TUNEL staining in control and zTERT-knockdown embryos coinjected with either zp53-MO- or zp53-control-MO at 48 hpf (a–d). A representative region of TUNEL-positive cells is indicated by the brackets (c, d). (E) Whole-mount o-dianisidine staining of hemoglobin in control and TERT-knockdown embryos coinjected with either zp53-MO or zp53-control-MO at 48 hpf. The intensity of the blood flow color over the yolk indicates the hemoglobin concentration (a–d). Wright-Giemsa staining of isolated blood cells from Cont-MO1- and zTERT-MO1-injected embryos in a p53-deficient background at 48 hpf (a′–d′). (F) Whole-mount in situ hybridization of control and TERT-knockdown embryos for c-myb and runx1 expression in p53+/+ and p53m/m embryos. The expression in the arterial region is indicated by arrowheads. (G) Altered expression levels of the indicated genes in TERT-deficient embryos in a p53-deficient background. Genes involved in the p53 pathway were analyzed by single-embryo RT-PCR. Similar results (data not shown) were obtained from this analysis of a number of individual embryos (more than 10 embryos for each gene). (H) Scoring of the number of circulating blood cells at 72 hpf after co-injection of zTERT-MO1 or Cont-MO1 and either GFP-, hBcl-2-, or E1B-19K-cDNA vectors. Embryos are classified as in (B). (I) Circulating blood cell numbers as a percentage of the control at 72 hpf after co-injection of zTERT-MO1 or Cont-MO1 and either GFP-control, hBcl-2, or E1B-19K expressing vectors. Blood cell numbers were counted in 10 embryos for each group. *P<0.01 (Student t-test). EXPRESSION / LABELING:
PHENOTYPE:
|
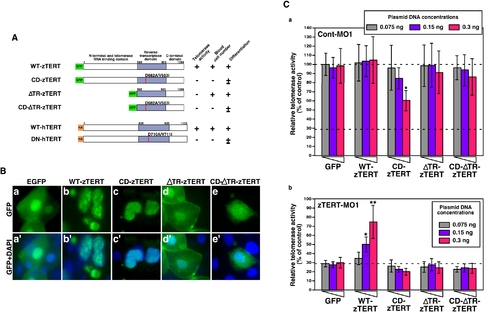
Expression of zebrafish or human TERT in zTERT-deficient embryos. (A) Schematic representations of zebrafish and human wild-type TERT and TERT mutants. All zebrafish TERT (zTERT) fragments were tagged with EGFP at their N-termini. The two amino acid substitutions in the RT domain of TERT (see Materials and Methods) are indicated by the red lines. Deletion mutants of the telomerase RNA-binding domain (ΔTR) of zTERT (zTERT-ΔTR) and its amino-acid substitution mutant ΔTR-CD-zTERT were generated. Human TERT (hTERT) and DN-hTERT were tagged with HA at their N-termini. The presence and absence of telomerase activity, detected by TRAP assay, are indicated as + and -, respectively. Significant recovery of blood cell number is indicated by +, and no significant recovery is denoted by -. Full and partial recovery of blood cell differentiation are indicated by + and ±, respectively. (B) Cellular localization of GFP-wild-type (WT) and -mutant zTERT proteins in the zebrafish embryo. GFP is fused to the N-terminus of each TERT protein. The indicated constructs (see Materials and Methods) were injected into zebrafish embryos, and the subcellular localization of the resulting GFP signals was observed at 48 hpf. (a–e) GFP, and (a′–e′) GFP and DAPI. (C) Quantitation of telomerase activity by the expression of zTERT plasmid constructs in zebrafish embryos. Three different concentrations of each zTERT plasmid construct (0.075, 0.15, or 0.3 ng) were co-injected in the indicated combinations with Cont-MO1 (8 ng) (a) or zTERT-MO1 (8 ng) (b), and both the intrinsic and extrinsic telomerase activity was detected by quantitative fluorometric TRAP assay. Each relative telomerase activity value was quantified as a percentage of the activity observed in Cont-MO1-injected embryos expressing a GFP empty vector (GFP) from three independent experiments. *P<0.01, **P<0.001 (Student t-test). |

Restoration of ineffective hematopoiesis in TERT-deficient embryos by the expression of zebrafish and human TERT. (A) The blood cell number is rescued in zTERT-MO1-injected embryos (8 ng MOs) at 72 hpf following the injection of the indicated TERT constructs. The percentage of the embryos affected was estimated and assigned into the three categories: No-change, Reduction, or Deficiency, as described above (a). Percentages of control circulating blood cell number in embryos at 72 hpf after the co-injection of several TERT constructs and either Cont-MO1 or zTERT-MO1 at 72 hpf. **P<0.001 (Student t-test) (b). Blood cell numbers were counted in 10 embryos for each group. (B) Rescue of heme appearance, visualized by whole-mount o-dianisidine staining for hemoglobin detection, in TERT-deficient embryos (8 ng MOs) following the injection of several TERT constructs (0.3 ng). Representative samples of whole-mount o-dianisidine staining (a). Percentages of the control heme intensity in embryos at 48 hpf after injection of several TERT constructs with Cont-MO1 or zTERT-MO1 at 48 hpf. *P<0.01, **P<0.001 (Student t-test) (b). Blood cell numbers were counted in 10 embryos for each group. (C) Wright-Giemsa staining of isolated blood cells from Cont-MO1- and TERT-MO1-injected embryos (8 ng) harboring the indicated plasmid constructs (0.3 ng) at 48 hpf. (D) Schematic model of hematopoiesis in TERT-deficient zebrafish embryos. In zebrafish embryos, hematopoiesis occurs in primitive and definitive waves. The first primitive/embryonic wave mainly generates primitive erythrocytes from progenitor cells in the intermediate cell mass (ICM) (represented by the blue color in the 20 and 28 hpf embryo models). The second definitive/adult wave gives rise to hematopoietic stem cells which have the potential to differentiate into all hematopoietic lineages and possess the self-renewal ability to maintain their blood system throughout life. Definitive hematopoietic cells, including stem cells, first arise in the aorta gonad mesonephros (AGM) region (represented by the red color in the 48 hpf embryo model). Definitive hematopoietic stem cells are thought to subsequently colonize the kidney, thymus, and pancreas [53], [88]. Our current model suggests that zTERT deficiency affects both primitive and definitive hematopoiesis in zebrafish, and induces impaired differentiation of the blood cells, including the erythrocyte lineage, prior to maturation. An ‘X’ next to the indicated gene denotes downregulated expression. The yellow ‘X’ in this schematic indicates a somewhat impaired pathway and the red ‘X’ designates a severely impaired pathway. (E) A TERT deficiency in the zebrafish embryo leads to abnormal differentiation and apoptosis, presumably of hematopoietic stem or progenitor cells. This subsequently leads to the circulation of immature blood cells with hypochromic anemia due to a disruption of both primitive and definitive hematopoiesis without telomere shortening. Non-canonical functions of TERT, i.e. authentic telomerase-independent roles, may thus regulate the differentiation of hematopoietic cells, as well as protect these cells from apoptotic cell death during hematopoiesis. |

zTERT mRNA and telomerase activity levels during embryogenesis and in adult fish. |

Analyses of Telomere length in zTERT morphants. |

Blood cell number and heme intensity in zTERT-MO2-injected embryos. |
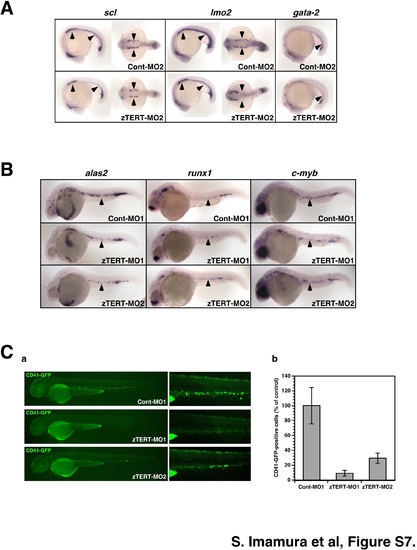
Whole-mount in situ hybridization of in zTERT-MO2-injected embryos. |
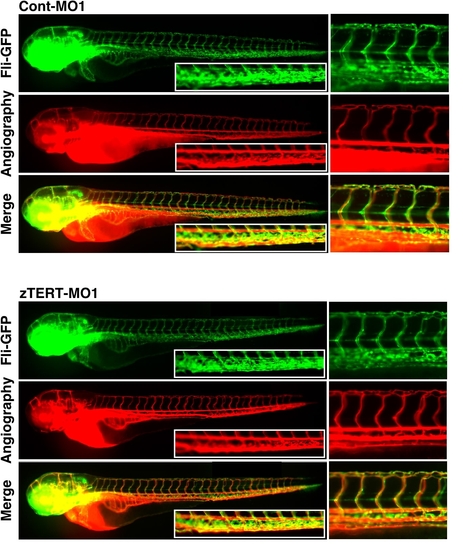
The effects of zTERT knockdown on the embryonic vasculature. |

Rescue of blood cell number and heme intensity in zTERT-MO2-injected embryos. |

Unillustrated author statements |