
- Title
-
odd skipped related1 reveals a novel role for endoderm in regulating kidney versus vascular cell fate
- Authors
- Mudumana, S.P., Hentschel, D., Liu, Y., Vasilyev, A., and Drummond, I.A.
- Source
- Full text @ Development

osr1 expression during early gastrulation. (A,B) osr1 expression in the germ ring at 30% epiboly (A) and in the gastrulating cells at 75% epiboly (B). (C) Two-color in situ of osr1 (blue) and ntl (red) mRNA transcripts at 30% epiboly. (D) Cross-section of C at the level indicated shows that osr1 is not expressed in the ntl-positive mesodermal cells farther from the margin (red arrowhead) and is restricted to mesendoderm cells closest to the margin (blue arrowhead). (E) Colocalization of osr1 (blue) and sox32 (red) mRNA transcripts at 30% epiboly. (F) Cross-section of E at the level indicated shows osr1 expression in the mesendoderm cells with some overlap with sox32-positive endodermal cells (blue arrowhead) but the absence of osr1 expression in the sox32-positive YSL cells (red arrowhead). (G-O) Magnified lateral views of 60% epiboly embryos just above the blastoderm margin with dorsal on the right. (G-I) Double-fluorescent in situ hybridization of osr1 (red) and ntl (green) probes at 60% epiboly. The images represent a maximum intensity projection of a confocal z-series stack (four slices, 1.9 μm each). (I) Merge of G and H showing distinct expression of osr1 (G) in endoderm cells (red arrowhead, G,I) that do not express ntl (H). osr1 (G) is co-expressed with ntl (H) in mesendoderm cells (green arrowhead, H,I). (J-L) Double-fluorescent in situ hybridization of osr1 (red) and sox17 (green) at 60% epiboly. Images represent a single confocal slice of 1.9 μm. (L) Merge of J and L showing co-expression of osr1 and sox17 in endoderm cells. (M-O) Double-fluorescent in situ hybridization of osr1 (red) and sox32 (green) at 60% epiboly. Images represent a single confocal slice of 1.9 μm. (O) Merge of M and N showing co-expression of osr1 and sox32 in endoderm cells. Scale bars: in G,I,L, 10 μm for G-O. EXPRESSION / LABELING:
|

osr1 expression during zebrafish development. (A) Cross-section of a tailbud stage embryo showing expression of lim1 in cells of the IM (A, inset) adjacent to presomitic mesoderm (arrowhead) and myoD in adaxial cells adjacent to the notochord (nc). (B) Magnification of A showing proximity of lim1-positive IM to the border of presomitic mesoderm (arrowhead). (C,D) Cross-section of a tailbud stage embryo showing expression of osr1 in bilateral stripes (inset, C) in cells lateral and ventral to the expression of lim1 (C,D) (arrowheads indicate the anatomical border of presomitic mesoderm. (E) At 18 somites, osr1 is expressed in bilateral stripes just anterior to the somites and in lateral mesoderm of the trunk and tail. (F) Cross-section of embryo in E at the level indicated in E showing osr1 expression ventral and lateral to the pronephros (outlined in F) and endodermal cells (arrowhead, F). (G) osr1 expression at 24 hpf in cells overlying the yolk extension. (H) Cross-section of the embryo in G at the level indicated shows osr1 expression in the ventrolateral mesoderm distinct from the pronephric ducts (circles) and in endoderm (arrowhead, H). (I-K) Expression of osr1 (blue) and pax2a (red). (J) Magnified views of boxed region in I show non-overlapping expression of osr1 (blue arrowhead) and pax2a (red arrowhead) in the intermediate mesoderm. (K) Cross-section at the same level shows expression of osr1 (blue arrowhead) in cells ventral and lateral to the cells expressing pax2a (red arrowhead). (L-N) Expression of osr1 (blue) and scl (red) at 12 somites. Magnified views of boxed regions in L show non-overlapping expression of osr1 and scl in the posterior (M) and anterior (N) regions of the PLM. (O-Q) Expression of osr1 (blue) and etsrp1 (red) at 12 somites. Magnified views of boxed regions in O show non-overlapping expression of osr1 and etsrp1 in the posterior (P,P′) and anterior (Q) regions of the PLM. (P,P′) Magnified view of the boxed region in O at different focal planes showing osr1- and etsrp1-positive cells at different dorsoventral positions, with osr1 in more ventral (P) and etsrp1 in the more dorsal cells (P′) with reference to yolk cells. |

osr1 knockdown results in segment-specific kidney defects. (A) osr1 gene structure and morpholino oligo targeting exon 2 (ex2d). (B) RT-PCR analysis of morpholino-induced osr1 mis-splicing. Blocking the exon 2 splice donor sequence resulted in the complete deletion of exon 2, which contains the ATG start codon and the entire coding sequence for the osr1 transcriptional regulatory domain and the first zinc finger. In embryos injected with 7.4 ng morpholino, no wild-type mRNA was detectable at 24 hpf, indicating that these morphant embryos were functionally null for osr1. A five-base pair mismatch control morpholino did not cause any molecular or phenotypic defects. Co-injection of osr1 synthetic mRNA along with the exon 2 donor morpholino rescued the osr1 phenotype in 53% (9/17) of embryos, as determined by pax2a expression (see Results), demonstrating specificity of the morpholino knockdown. (C) Expression of ae2 in the proximal pronephros (white arrowhead) is absent in osr1 morphants (D), whereas the distal pronephros is unaffected (black arrowhead). Immunofluorescence using anti-NaK ATPase alpha6F monoclonal antibody labels the entire pronephros in wild-type embryos (E), whereas expression is specifically lost (F) in the proximal nephron (white arrowhead) of osr1 morphants, leaving the distal pronephros unaffected (red arrowhead). EXPRESSION / LABELING:
PHENOTYPE:
|

osr1 is required for glomerular morphogenesis. (A,B) Expression of wt1a in control (A) and osr1 morphants (B) at 26 hpf. (C,D) Histological cross-sections of the 26 hpf glomerular progenitors in wild-type (C) and osr1 morphants (D) show equivalent expression of wt1a (arrows). (E,F) Cross-section of wild-type glomerulus at 48 hpf (E) shows wt1a expression in the midline vascularized glomerulus (arrow), whereas in osr1 morphants (F) wt1a-positive podocytes remain in an immature state (arrows) and fail to coalesce to the midline. (G,H) Expression of the podocyte marker nephrin is lost in osr1 morphants (arrowhead, H) when compared with the control embryos (arrowhead, G). Segment-specific loss of ae2 expression in the proximal pronephros is evident in the osr1 morphants (H) when compared with controls (G) at 48 hpf. |
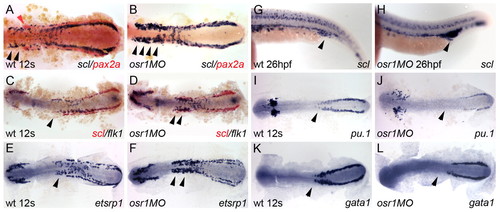
osr1 knockdown expands vascular progenitor tissue. (A) scl (blue) and pax2a (red) expression in wild-type embryos labels adjacent bands (arrowheads) of intermediate mesoderm in 12-somite stage wild-type embryos. (B) osr1 knockdown results in expansion of scl-positive tissue, most prominently in anterior LPM (arrowheads) and loss of pax2a-expressing cells. (C) flk1 (blue) and scl (red) expression in 12-somite wild-type embryos (arrowhead). (D) osr1 knockdown increases the number of flk1-expressing cells (arrowheads). (E) etsrp1 expression in control 12-somite embryos (arrowhead). (F) etsrp1 expression is expanded in 12-somite stage osr1 morphants (arrowheads). (G) At 26 hpf, scl is expressed in the blood islands and forming venous plexus (arrowhead). (H) 26 hpf osr1 morphants show an expansion of scl-positive tissue in the region of the forming venous plexus (arrowhead). (I,J) Expression of the monocyte lineage marker pu.1 in wild-type embryos (I) and osr1 morphants (J) shows a reduction of expression in the anterior aspect of its LPM expression domain (arrowheads). (K,L) Similarly, expression of the erythrocyte marker gata1 in wild-type embryos (K) and osr1 morphants (L) shows a reduction of expression in its most anterior expression domain (arrowheads). EXPRESSION / LABELING:
PHENOTYPE:
|

Overexpression of osr1 causes expansion of pronephric progenitor number and a reduction in angioblast number. Control embryos (A,C) and embryos injected with 100 pg of osr1 mRNA (B,D). (A) Control expression of pax2a is expanded after injection of osr1 mRNA (B), specifically in the mid-portion of the IM (arrowhead, B), which is normally downregulated in the control embryos at the 13-somite stage (arrowhead, A). myoD is used as an internal control for somite staging in these embryos (A,B). (C,D) Expression of scl is lost in the anterior lateral plate mesoderm (arrowhead, D) in the embryos injected with osr1 mRNA when compared with the uninjected controls (arrowhead, C). EXPRESSION / LABELING:
|
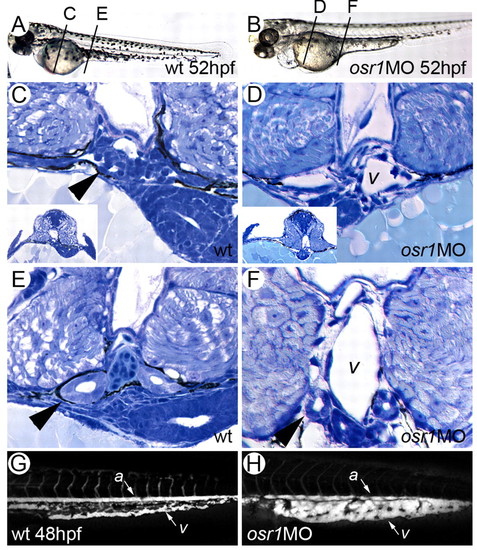
Loss of pronephric epithelial differentiation and vascular expansion in osr1 morphants. Control (A,C,E,G) and osr1 morphants (B,D,F,H) at 52 hpf. (A) Wild-type 52 hpf embryo showing position of histological sections in C and E. (B) osr1 morphant embryo showing position of histological sections in D and F. (C) Cross-section at the level of the fin buds (inset) shows normal glomerular structure (arrowhead) and connecting pronephric tubules. (D) Cross-section at the level of the fin buds in an osr1 morphant (inset) shows absence of pronephric tubules and glomerulus and expansion of cardinal vein (v). (E) In more posterior sections of wild-type embryos, the pronephric epithelial tubules (arrowhead) and cardinal vein are of roughly similar dimensions. (F) In osr1 morphants, pronephric tubules are reduced in diameter compared with wild-type (arrowhead) and the cardinal vein (v) is significantly expanded. (G) Angiogram of wild-type embryo trunk and tail region highlights the aorta (a) and the common tail vein (v). (H) Angiogram of an osr1 morphant highlights a grossly expanded venous plexus in the tail (v). Intersomitic vessels were present in osr1 morphants but are not shown in the confocal sections used in this projection. PHENOTYPE:
|

Ectopic expression of pax2a rescues intermediate mesoderm patterning in osr1 morphants. (A-C) Expression of ae2 in the pronephros of 24 hpf control (A), osr1 morphant (B) and osr1 morphant co-injected with pax2a mRNA (C). Horizontal lines indicate the length of the wild-type ae2-positive proximal nephron segment. (D-F) Expression of scl in the anterior lateral mesoderm of 24 hpf control (D), osr1 morphant (E) and osr1 morphant co-injected with pax2a mRNA (F). Horizontal lines indicate the length of the wild-type scl-positive anterior lateral mesoderm. (G) Quantification of pax2a rescue of ae2-positive proximal pronephric nephron cells (see text for details). |
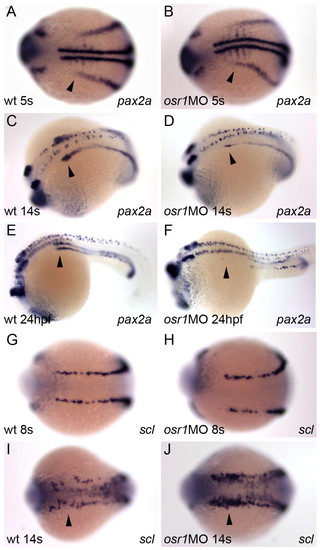
osr1 knockdown does not affect specification of pronephric and angioblast mesoderm, but does affect their subsequent maintenance. (A,B) Expression of pax2a and myoD in control (A) and osr1 morphants (B) is similar at five somites (arrowheads in A and B). myoD is used as a internal somite staging control. (C,D) Expression of pax2a in a 14-somite control (C) and osr1 morphants (D) reveals a substantial reduction in the number of pax2a-positive cells in the anterior IM (arrowheads, C,D). (E,F) Expression of pax2a in 24 hpf control (E) and osr1 morphants (F) shows a complete loss of pax2a-positive cells in the proximal pronephros (arrowheads, E,F). (G,H) Expression of scl in osr1 morphants (H) is similar to that of control embryos at 8 somites (G). (I,J) However, by the 14-somite stage, the number of scl-expressing cells is significantly upregulated in the anterior lateral plate mesoderm of osr1 morphants (arrowhead, J) when compared with control embryos at the same stage (arrowhead, I). EXPRESSION / LABELING:
PHENOTYPE:
|
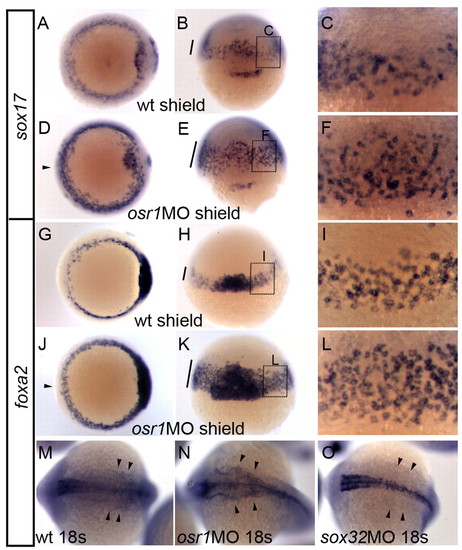
osr1 knockdown causes expansion of endoderm. (A-F) Expression of endoderm marker sox17 in control (A-C) and osr1 morphants (D-F) at the shield stage. (A,D) Dorsal views; (B,E) side views with dorsal facing; (C,F) magnified views of boxed regions in B,E, respectively. The number of tiers of sox17-expressing cells was significantly increased in osr1 morphants at the blastoderm margin (bar in E,F) and in the ventral region of the embryo (arrowhead, D) when compared with control (A,C; bar in B). (G-L) Expression of mesendoderm marker, foxa2 in control (G-I) and osr1 morphants (J-L) at the shield stage. (G,J) Dorsal views; (H,K) side views with dorsal facing; (I,L) magnified views of boxed regions in H,K, respectively. The number of tiers of foxa2-expressing cells were significantly increased in osr1 morphants with more layers of foxa2-expressing cells at the blastoderm margin (bar in K,L) and enhanced expression in the ventral region of the embryo (arrowhead, J) when compared with control (G,I; bar in H). (M-O) Expression of foxa2 at 18 somites in control (M), osr1 morphants (N) and sox32 (cas) morphants (O). Development of foxa2-positive pharyngeal endoderm was enhanced in osr1 morphants (arrowheads, N) when compared with control embryos (arrowheads, M) and was completely blocked by sox32 knockdown (arrowheads, O). EXPRESSION / LABELING:
PHENOTYPE:
|

Elimination of endoderm development in osr1 morphants rescues proximal pronephric phenotype. (A-D) Expression of pax2a in control (A), osr1 morphant (B), sox32 morphant (C) and osr1+sox32 double morphants (D). Loss of osr1 resulted in loss of proximal pax2a pronephric expression (arrowhead, B) when compared with control 18-somite stage embryos (arrowhead, A). sox32 (cas) morphants lacking endoderm showed slightly enhanced expression of pax2a in the proximal nephron (arrowhead, C). The loss of pax2a expression in the proximal pronephros of osr1 morphants was rescued by elimination of endoderm in the osr1+ sox32 double morphants (arrowhead, D). (E-G) Expression of pax2a in uninjected bon heterozygote incross embryos (E) and osr1 morpholino injected bon incross embryos (F,G) at 24 hpf. pax2a expression was lost from the proximal pronephros in 47 out of 64 of the injected embryos (73%) (F). Loss of pax2a expression from the proximal pronephros was rescued in 17 out of 64 (27%) osr1 MO injected, bon heterozygote incross embryos. Arrowheads in E-G indicate expression of pax2a in the proximal pronephros. EXPRESSION / LABELING:
PHENOTYPE:
|

osr1 expression in endodermal organs at 48 hpf. (A) Expression of osr1 mRNA in whole mount at 48 hpf, dorsal view. Lines represent plane of section in B, C. (B) Histological section just anterior to the fin bud shows osr1 expression in the forming liver (li). Arrowhead indicates the forming glomerulus, which is negative for osr1. (C) Histological section at the level of the fin shows osr1 expression in the gut (g). |

osr1 loss of function does not cause general A-P patterning defects in the pronephros. Expression of trpM7 in control (A) and osr1 morphants (B) is restricted to the late proximal pronephric nephron segment. ret1 expression in control (C) and osr1 morphants (D) is unchanged in the most distal pronephric nephron segment. |
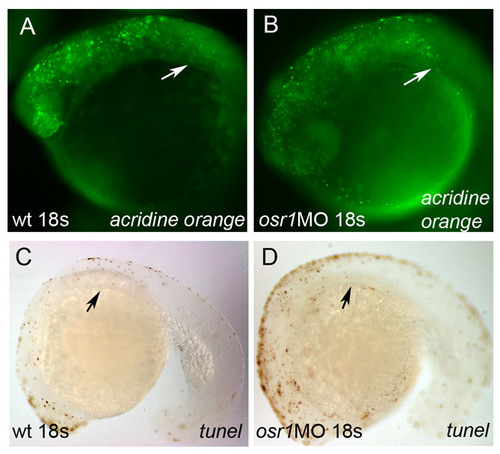
osr1 loss of function does not affect mesoderm survival. Acridine Orange staining for apoptotic cells in control (A) and osr1 morphant (B) 18-somite embryos. Arrowheads indicate area affected in osr1 morphants. TUNEL staining of control (C) and osr1 morphant (D) 18-somite embryos show unchanged patterns of apoptosis. Arrowheads indicate the area anterior intermediate mesoderm most strongly affected in osr1 morphants. PHENOTYPE:
|
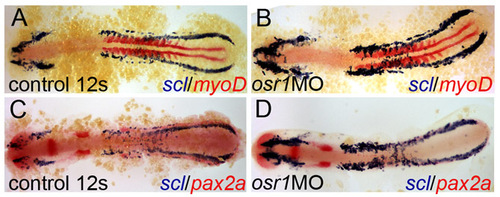
Expanded vascular differentiation is not due to an altered rate of development. (A) scl (blue) and myoD (red) expression in wild-type embryos at the 12-somite stage. (B) osr1 knockdown results in expansion of scl-positive tissue, most prominently in anterior PLM. myoD is used as an internal staging control and demonstrates both control and osr1 morphants are at the 12 somite stage. (C) scl (blue) and pax2a (red) expression in wild-type embryos from the same clutch of embryos as A and B. (D) osr1 knockdown results in expansion of scl-positive tissue, most prominently in anterior PLM, and loss of pax2a-expressing cells. (C, D) are lower magnification views of A,B in Fig. 5 respectively. EXPRESSION / LABELING:
PHENOTYPE:
|
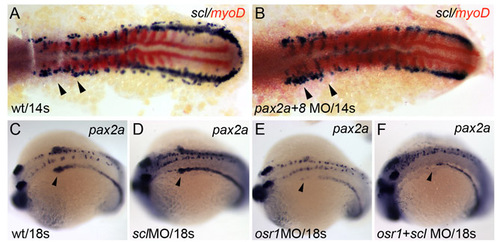
Intermediate mesoderm patterning in pax2/8 and scl morphants. Expression of scl (blue) and myoD (red) in control (A), and pax2a/pax8 double morphant (B) demonstrates that loss of Pax gene expression does not cause scl upregulation. Arrowheads indicate the area of strongest upregulation of scl seen in osr1 morphants. Expression of pax2a in control (C), scl morphant (D) similarly shows no large expansion of pax2a expression. Expression of pax2a in osr1 morphant (E) and osr1/scl double morphant (F) shows no rescue of pax2a expression. Arrowheads in C-F indicate the proximal nephron segment lost in osr1 morphants. The data indicate that Pax genes and scl are not involved in a mutual repression mechanism. EXPRESSION / LABELING:
|