
- Title
-
Nodal/Bozozok-independent induction of the dorsal organizer by zebrafish cell lines
- Authors
- Hashiguchi, M., Shinya, M., Tokumoto, M., and Sakai, N.
- Source
- Full text @ Dev. Biol.

Expression of specific marker genes in the secondary axis. (A, B) Dorsal telencephalic marker gene emx1. (C, D) Rhombomere 3 and 5 marker gene krx20. (E, F) Floor plate marker gene shh. (G, H) Somite marker gene myoD. (A, C, E, G) Control, non-implanted embryos. (B, D, F, H) cell-implanted embryos. The secondary axis had a visible notochord. (A–C, F–H) Lateral views. (D, E) Dorsal views. All embryos are at the pharyngula stage (24 hpf). Arrows indicate the ectopic expression of the marker gene inthe secondary axis. Scale bar, 100 μm. EXPRESSION / LABELING:
|

Secondary axis tissues induced following cultured cell implantation. (A) Induced complete secondary axis. (B) Cross section of panel A. The secondary axis had a notochord (no) and neural tube (nt). (C) A second example of induced tissues in the secondary axis in a more posterior region than that shown in panel B. (D) High-magnification view of the region boxed in panel C shows that the secondary axis has a notochord, neural tube, somites (so), and gut (gu). (E) Schematic summary of secondary tissues induced by cell lines. ‘Two eyes’ indicates complete secondary axis with two eyes, trunk and tail; ‘One eye’ means cyclopean with trunk and tail; ‘Trunk with o.v.’ indicates a secondary axis with otic vesicles in the trunk and tail, but without head structures; and ‘Trunk without o.v.’ indicates a secondary axis without head structures or otic vesicle in the trunk, but with a tail. Here, the induced axis was fused with the host endogenous axis in the posterior part of the tail. ‘Part of tail’ indicates a secondary axis only with part of a tail structure. (F, G) Secondary axis with two eyes, trunk and tail induced by ZE6-2 (F) or ZE24-2 (G). (H) Secondary axis with one eye, trunk and tail induced by ZE72-1. (I, J) Secondary axis with trunk, otic vesicle and tail induced by ZE24-2 (I) or ZE120-1 (J). (K, L) Secondary axis with trunk, tail and no otic vesicle induced by ZE24-2 (K) and ZE120-1 (L). (M) Secondary axis with an ectopic tail induced by ZE72-1. Some ectopic tails had floor plate. All embryos were observed at 24 hpf. e, eye of secondary axis; o.v., otic vesicle of secondary axis; t, tail of secondary axis. Arrowheads indicate the implanted DiI-labeled cell clumps at the secondary axis region. Arrows indicate the secondary axis. Scale bar, 100 μm. |
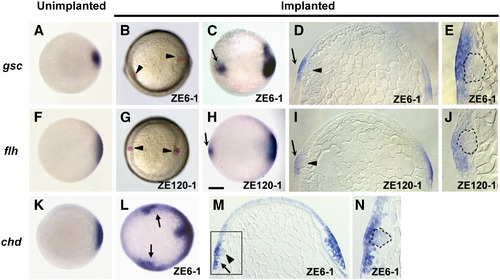
Induction of dorsal organizer markers by cell line implantation into mid-blastula. Ectopic expression of gsc (A–E), flh (F–J) and chd (K–N) is apparent around implanted cells but not in the cells themselves. (A, F, K) Embryos without implanted cells. (B, G) Embryos with implanted cells. (C, H) Whole-mount in situ hybridization for gsc and flh in the embryos shown in panels B and G, respectively. Ectopic gsc was observed in 24 of 28 embryos, ZE6-1; 22 of 31 embryos, ZE24-1; 13 of 32 embryos, ZE72-1; 15 of 33 embryos, ZE120-1. Ectopic flh was observed in 25 of 32 embryos, ZE6-1; 34 of 37 embryos, ZE24-1; 32 of 34 embryos, ZE72-1; 31 of 38 embryos, ZE120-1. (L) Whole-mount in situ hybridization for chdin implanted embryos. Ectopic chd was observed in 5 of 5 embryos, ZE6-1. (D, E) Longitudinal section and high-magnification view of panel C. (I, J) Longitudinal section and high magnification of panel H with dorsal to the right. (M, N) Longitudinal section and high-magnification view of panel L. (A–C, F–H, K, L) Animal pole views. (D, E, I, J, M, N) Lateral views. Dotted lines in panels E, J and N represent the colonized implanted cells. All embryos are early gastrula (6 hpf). Arrowheads indicate the implant cells and arrows indicate the ectopic expression of gsc, flh and chd. Scale bar, 100 μm. |

Induction of the dorsal organizer by implanted cell lines without ectopic boz or sqt expression. (A) Expression of boz and sqt in embryos and cultured cells by RT-PCR. Neither boz nor sqt were detected in cell lines. (B, F) boz expression (B) and sqt expression (F) of an embryo with no implanted cells. (C–E, G, H) Embryos with implanted cells. (D, H) Whole-mount in situ hybridization for boz in panel C and for sqt in panel G, respectively. Arrowheads indicate the cell implants. (E) Longitudinal section of panel D with the ventral side to the left. Dotted lines surround the implanted cells. No boz-positive embryos were observed following implantation of ZE6-1 cells (n = 23) or ZE120-1 cells (n = 36). We also observed no sqt-positive embryos among embryos with implanted ZE6-1 cells (n = 25). (B–D, F–H) Animal pole views. (E) Lateral views. All embryos are late blastula stage (5 hpf). Scale bar, 100 μm. |

Induction of the dorsal organizer by cell line implantation in MZoep mutants. (A–D) Unimplanted embryos, (E–H) ZE6-1 implanted and (I–L) ZE120-1 implanted MZoep embryos. Whole-mount in situ hybridization for gsc (B, F, G) and flh (C, J, K). (F, G) Expression of gsc in panel E (F) and a longitudinal section of panel F (G). Ectopic gsc was observed in 19 of 20 embryos, ZE6-1. (J, K) Expression of flh in panel I (J) and a longitudinal section of panel J (K). Ectopic flh was observed in 20 of 20 embryos, ZE6-1; 22 of 22 embryos, ZE120-1. Dotted lines in panels G and K indicate the implanted cells. (H, L) Induced secondary axis phenotype in MZoep (30 of 31 embryos, ZE6-1; 29 of 39 embryos, ZE120-1). (A–C, E, F, I, J) Animal pole views. (D, G, H, K, L) Lateral views. (A–C, E–G, I–K) 6 hpf. (D, H, L) 24 hpf. e, eye of secondary axis; o.v., otic vesicle of secondary axis; t, tail of secondary axis. Arrowhead indicates the implanted cells. The large arrows in panels H and L indicate the secondary axis, and small arrows in panels F and J indicate the expression of gsc and flh. Scale bar, 100 μm. |

Induction of the dorsal organizer is unrelated to Activin signaling. (A) Expression of activin in each cell line by RT-PCR. activinβA was detected in the ZE6-1, ZE24-1, ZE120-1 cell lines, and Sertoli cell lines (ZtA6-6, ZtA6-12-1) and activinβB was detected in the ZE6-1 cell line and Sertoli cell lines (ZtA6-6, ZtA6-12-1). (B, D, F) Unimplanted; (C, E, G) ZE6-1 implanted embryos. (B, C) Embryos injected with lefty1. Secondary axis induced in the lefty1-injected embryos (C; 18 of 19 embryos, ZE6-1). (F, G) Whole-mount in situ hybridization for lefty1. We observed no ectopic expression of lefty1 in implanted embryos (G; n = 23). (B, C) Lateral views at 24 hpf. (D–G) Animal pole views at 6 hpf. e, eye of secondary axis; o.v., otic vesicle of secondary axis; t, tail of secondary axis. Arrowhead indicates the cell implants. The large arrows in G indicate the secondary axis. Scale bar, 100 μm. |

Other possible signals involving the induction of the dorsal organizer by cultured cells. (A) Expression of fgf3, fgf8, mkp3 and dkk1 in each cell line by RT-PCR. No or little expression was detected in the cultured cells. (B–E) Whole-mount in situ hybridization for dkk1. Ectopic expression of dkk1 was induced in the implanted embryos (ZE6-1, 16 of 16 embryos, ZE6-1). (B) Unimplanted embryos. (C–E) ZE6-1 implanted embryos. Expression was observed in the marginal region in host embryos, but was not detected in animal pole region. (E) Longitudinal section of panel D with ventral to the left. Dotted lines surround the implanted cells. (B, C) Animal pole views. (D, E) Lateral views. (B–E) 5 hpf. Arrows indicate the ectopic expression of dkk1. Arrowheads indicate the cell implants. Scale bar, 100 μm. |
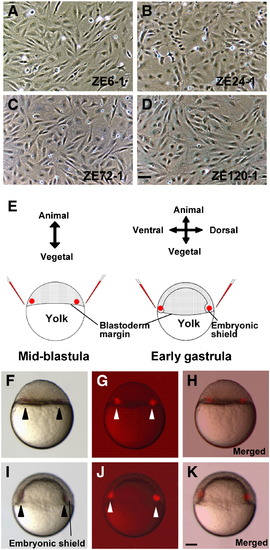
Morphological characteristics of zebrafish cell lines and implantation of these cell lines into mid-blastula or early gastrula. After several passages, each cell line appeared as a fibroblast monolayer. Cells were derived from (A) early gastrula stage embryos (ZE6-1), (B) pharyngula period embryos (ZE24-2), (C) protruding-mouth stage larvae (ZE72-1), and (D) swimming larva period larvae (ZE120-1). (E) Schematic representation of implantation. About 50 DiI-labeled cells per region were implanted into each half of the host marginal region. (F–H) Cell clumps implanted into both halves of the blastoderm margin in the mid-blastula (3 hpf). (I–K) Cell clumps implanted into the shield and the opposite side in early gastrula (6 hpf). (F, I) Bright field image. (G, J) Dark field image. (H, K) Merged images of F and G (H), and I and J (K). All views are lateral. Arrowheads indicate implanted cell clumps. Scale bars are 50 μm (A–D) and 100 μm (F–K). |

Induction of gsc expression by cell implantation into the animal pole of embryos. Ectopic expression of gsc is visible around implanted cells despite implantation into the animal pole. (A) Control, non-implanted embryos. (B, C). Implanted embryos. Ectopic gsc was observed in 20 of 23 embryos in ZE6-1 implanted embryos. (C) Whole-mount in situ hybridization for gsc in an implanted embryo. (A–C) Animal pole views. |
Reprinted from Developmental Biology, 321(2), Hashiguchi, M., Shinya, M., Tokumoto, M., and Sakai, N., Nodal/Bozozok-independent induction of the dorsal organizer by zebrafish cell lines, 387-396, Copyright (2008) with permission from Elsevier. Full text @ Dev. Biol.