
- Title
-
Origin and shaping of the laterality organ in zebrafish
- Authors
- Oteíza, P., Köppen, M., Concha, M.L., and Heisenberg, C.P.
- Source
- Full text @ Development

Dorsal forerunner cells are derived from dorsal surface epithelial cells. Images of a time-lapse multi-photon confocal movie of a zebrafish embryo expressing Tg(β-actin:HRAS-EGFP). Dorsal view with animal pole to the top. (A-C) Single focal planes through the surface of the embryo at early dome stage (∼4.2 hpf) and subsequent time points show the progression of dorsal surface epithelial (DSE) cells towards the vegetal pole. Some marginal DSE cells form filopodia-like protrusions at their leading edge (arrows and inset in A). (D-F) Images of the deep cell layer at equivalent time points to A-C, with the deep cell margin marked with arrowheads. DFCs (brackets) become visible directly in front of the deep cell margin shortly after the dome stage (E) and then move progressively away from the margin (F). (G-I) Fate mapping of DSE cells shows that nine of these cells at or close to the margin (coloured), but no deep cells, become converted into DFCs. Cells remaining within the enveloping layer (EVL) are outlined in white and traced by number. The same principal finding was made in all five embryos analysed by live imaging. The DSE-to-DFC conversion occurs as the DSE cells round up and become covered by the trailing EVL cells that form the new EVL margin. During this process, two of these cells (light green and dark blue) can be seen to divide once (H,I). During vegetal movement, both EVL cells and DFCs converge to the dorsal side. (J-L) Three-dimensional rendering and cutting of the image stacks along the dotted lines shown in G-I allows simultaneous display of the xy and yz axes, and reveals the repositioning of red and dark-blue DSE cells below the tissue. (M) Schematic representation of DSE-to-DFC conversion and deep cell internalisation as observed in the live recording. Two DSE cells, depicting the red and dark-blue DSE cells in the movie, become positioned beneath the EVL to become DFCs. The blue cell had divided immediately prior to internalisation. The attachment point linking DFCs to the EVL is shown as a yellow spot. Two deep cells (asterisks) are shown to undergo internalisation to form hypoblast. Scale bar: 30 μm. EXPRESSION / LABELING:
|

Apical attachment of the dorsal forerunner cell cluster to the enveloping layer and subsequent detachment to form a cellular rosette during gastrulation. (A-B′) Confocal images of Tg(β-actin:HRAS-EGFP) zebrafish embryos immunolabelled with an anti-aPKC-ζ antibody. GFP (green) and aPKC-ζ (red) channels are merged. Single dorsal focal planes (A,B) and sagittal sections at the position of the dotted line (A′,B′; embryo surface to the right) are shown. Animal pole is to the top. A surface plane through an embryo at 50% epiboly shows that presumptive DFCs (asterisks) are partially positioned underneath the EVL (A). Clear enrichment of aPKC-ζ is found at the contact point between one of the DFCs and the overlying EVL (A,A′; arrowheads). At 75% epiboly, the EVL completely covers the DFCs (B). A sagittal section shows bottle-shaped DFCs with strong aPKC-ζ enrichment at the contact points with the EVL (B′; arrowheads). (C-D′) Confocal images of Tg(sox17:GFP)-expressing embryos immunolabelled with an anti-ZO-1 antibody. GFP (green) and anti-ZO-1 (red) channels are merged. At 80% epiboly, DFCs form a compact cluster that is in contact with the interior surface of the EVL close to the margin. Anti-ZO-1 signal is enriched at contact points (arrowheads) between DFCs and the overlying EVL (dorsal z-projection is shown in C; sagittal section at the position of the dotted line in C′). At the bud stage, a ZO-1-rich focal point (arrowhead) is seen at the centre of the DFC cluster (single focal plane is shown in D; sagittal section at the position of the dotted line in D′). The cluster is disconnected from the overlying EVL. (E-F′) Images of a time-lapse multi-photon confocal movie of a Tg(β-actin:HRAS-EGFP) embryo, showing DFC cluster arrangement and tracing of two DFCs (green and yellow dots). Single dorsal focal planes (E,F) and sagittal sections at the position of the dotted line (E′,F′) are shown. At 90% epiboly, several bottle-shaped DFCs are attached to the overlying EVL via a single focal point (asterisk), including the two marked cells (E,E′; arrow indicates the position of the EVL). At +102 minutes, the marked cells have internalised and become part of a DFC rosette that is arranged around an interior focal point (F,F′; focal point marked by asterisk). Scale bars: 30 μm. EXPRESSION / LABELING:
|

Lumen and cilia formation in Kupffer's vesicle. (A-C)Images of a time-lapse multi-photon confocal movie of a zebrafish embryo expressing Tg(β-actin:HRAS-EGFP;sox17:GFP). Single focal planes at the interior of the DFC cluster are shown at the bud stage and subsequent time points, as indicated. Anterior is to the top. At the bud stage, bottle-shaped DFCs are arranged around two focal points (A, arrowheads). Shortly after, these focal points have coalesced into a single focal point (B, arrowhead) from which a single lumen forms (C). (D-I) Confocal images of Tg(sox17:GFP)-expressing embryos immunolabelled with an anti-ZO-1 antibody. GFP, green; anti-ZO-1, red. Single focal planes at the interior of the DFC cluster (D-F) and 3D renderings of the anti-ZO-1 labelling (G-I) are shown. Arrowheads mark equivalent structures in single focal planes and renderings. At the bud stage, multiple, widely spread ZO-1-rich accumulations are found in the interior of the DFC cluster (D,G). At the 1-somite stage, ZO-1 clusters are more connected and condensed, and small lumina are observed (E,H). At the 2-somite stage, a single, large lumen delineated by ZO-1 is observed inside the cluster (F,I). (J-O) Confocal images of Tg(sox17:GFP)-expressing embryos (green) double labelled with anti-ZO-1 (blue) and anti-acetylated α-tubulin (red) antibodies. Single focal planes are shown for merged (J-L) and single (M-O) channels. At the 1-somite stage, DFCs are positioned around multiple small lumina delineated by ZO-1, in which short, tubulin-rich cilia are observed (J,M). Between the 2- and 4-somite stages, a single, expanding lumen is observed (K,L), which contains cilia that are increasing in length (N,O). Scale bars: 30 μm. EXPRESSION / LABELING:
|
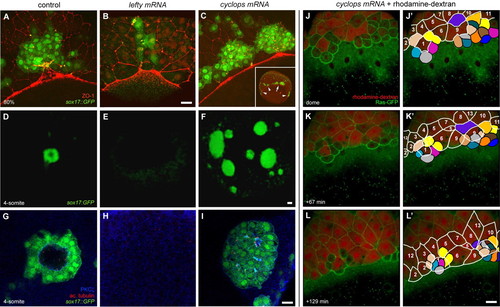
Nodal/TGFβ signalling regulates dorsal forerunner cell formation in a non-cell autonomous manner. (A-C) Confocal images of 75% epiboly Tg(sox17:GFP)-expressing zebrafish embryos immunolabelled with an anti-ZO-1 antibody. z-projections with GFP in green and anti-ZO-1 in red are shown. In a control embryo, DFCs form a compact cluster in contact with the EVL margin (A). A sibling embryo of equivalent age injected with 100 pg of lefty-encoding mRNA shows a markedly reduced number of DFCs (B). By contrast, a sibling embryo injected with 100 pg of cyclops-encoding mRNA shows a clear increase in DFC number (C). A low-magnification image of the same embryo (inset in C) shows the appearance of multiple, widely spaced DFC clusters positioned all along the EVL margin (the main cluster is indicated by an arrow in the inset, additional clusters by arrowheads). (D-I) Confocal images of 4-somite stage Tg(sox17:GFP)-expressing embryos immunolabelled for aPKC-ζ and acetylated tubulin. Vegetal views of 3D-projections of low-magnification images showing GFP in green (D-F) and single focal planes of high-magnification images showing GFP in green, aPKC-ζ in blue and acetylated tubulin in red (G-I). In a control embryo, DFCs form a single, oval-shaped DFC cluster with a ciliated interior lumen (D,G). In a lefty-mRNA-injected embryo of equivalent age, no DFCs are observed (E,H), whereas a cyclops-mRNA-injected embryo displays multiple, abnormally large DFC clusters with significantly smaller, ciliated lumina (F,I). (J-L′) Images from a time-lapse confocal movie of a Tg(β-actin:HRAS-EGFP) embryo co-injected with 50 pg of cyclops mRNA and rhodamine-dextran into a single marginal blastomere at the 64-cell stage. The animal pole is to the top. Three-dimensional projections of the embryo at the dome stage (∼4.2 hpf) and subsequent time points are shown (J-L). Fate mapping of surface epithelial cells shows that ten rhodamine-negative cells and five cells with low rhodamine signal (coloured) become displaced below the EVL margin (J′-L′). By contrast, all cells remaining at the embryonic surface (cells outlined in white and traced by number) are rhodamine-positive. Scale bars: 70 μm in D-F; 20 μm in A-C,G-L′. EXPRESSION / LABELING:
|
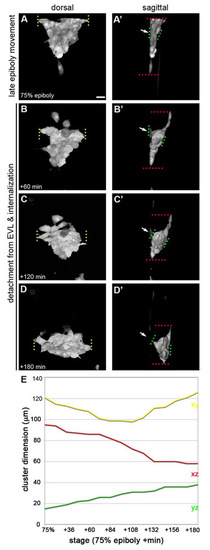
Morphological changes of the dorsal forerunner cell cluster at the end of epiboly. (A-D′) Three-dimensional renderings of the dorsal forerunner cell (DFC) cluster in a Tg(sox17:GFP) embryo as dorsal views (A-D; animal pole to the top) and sagittal views (A′-D′; enveloping surface layer to the left). (A,A′) DFC cluster at 75% epiboly stage. Cluster size is shown along the following axes: x (medio-lateral, yellow dotted lines in A), y (animal-vegetal, red dotted lines in A′), and z (surface-depth, green dotted line in A′). At this stage, the cluster is composed of approximately 36 cells. Note that the DFC cluster is still in contact with the enveloping layer (EVL) (white arrow in A′). (B,B′) After 60 minutes, the cluster has narrowed along the x and y axes (B and B′), and extended along the z axis (B′). At this stage, the number of DFCs had increased to 41, but remained approximately constant during the remainder of the recording. Note that the dorsal blastoderm (not labelled) has started to move between the DFC cluster and EVL (animal concavity in B′). (C,C′) After 120 minutes, the cluster has begun to extend along the x axis while further narrowing along the y (C) and extending along the z (C′) axes. Note that the DFC cluster is still partially attached to the EVL (white arrow in C′). (D,D′) After 180 minutes, the DFC cluster exhibits a spheroid shape with wider x, shorter y and thicker z dimensions (D and D′). Note that the DFC cluster is now completely detached from the EVL (white arrow in D′). (E) Quantification of the changes in DFC cluster size along the Y (yellow), Y (red) and Z (green) axes. Scale bar: 20 μm. EXPRESSION / LABELING:
|
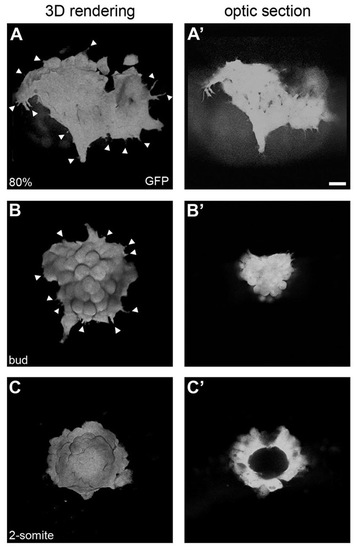
Mesenchymal-to-epithelial transition of the dorsal forerunner cell cluster. Three-dimensional renderings (A-C) and single focal planes through the centre of the DFC cluster (A′-C′) in a Tg(Sox17:GFP) embryo. At 80% epiboly (A,A′), migratory DFCs show numerous cell protrusions without clear directionality (arrowheads in A). At bud stage, cell protrusions start diminishing as the cluster rounds up (arrowheads in B) and organises into a more compact structure (B′). At the 2-somite stage, the DFC cluster has transformed into a vesicle (C) with a lumen at its centre (C′). Scale bar: 20 μm. EXPRESSION / LABELING:
|