
- Title
-
Dynamic Fgf signaling couples morphogenesis and migration in the zebrafish lateral line primordium
- Authors
- Lecaudey, V., Cakan-Akdogan, G., Norton, W.H., and Gilmour, D.
- Source
- Full text @ Development

FGF signaling is active in the migrating primordium. (A-D) Confocal images of the primordium in 36-hpf cldnb:gfp embryos labelled with a GFP antibody and indicated in situ hybridization probes. Right panels are transmission images of NBT-BCIP stainings, which were inverted and overlaid with GFP (left). Arrows point to fgf10-expressing cells (C), or to cells with reduced expression of fgfr1 (A) or pea3 (D). (E-J) Fluorescent images of 36-hpf cldn:bgfp wild-type (E,F), fgf3;fgf10 double mutant (G,H) and SU5402-treated (I,J) embryos labelled with a pea3 probe (red) and GFP (green). F,H and J are close-ups of the primordium in E,G and I (white dashed frames). Anterior is to the left. Scale bars: 20 μm (unless stated otherwise). EXPRESSION / LABELING:
|

FGF signaling is required for the migration and subdivision of the primordium into rosettes. (A-E) Lateral line migration in wild-type (A), fgf10 mutant (B), fgf3 mutant (C) and fgf3;fgf10 double mutant (D) cldnb:gfp embryos at 42 hpf, quantified in E (n=18 for each genotype). (F-I) Representative primordia of wild-type (F), fgf3;fgf10 double mutant (G), SU5402-treated (H) and heat-shock induced dn-fgfr1 (I) embryos showing the stretched shape and the lack of rosettes resulting from the loss of Fgf activity. (J) The primordium length in each context (9 wild-type, 17 SU5402-treated and 7 fgf3;fgf10 double mutant primordia were measured). (K) fgf3 expression is expanded in fgf10 mutants. Arrows point to the ectopic dots of fgf3 expression in the center of rosettes. Anterior is to the left. Scale bar: 20 μm. |

Hair cell specification is not required for rosette assembly. (A,B) atoh1a expression is expanded in MoAtoh1a-injected embryos (B) compared with control embryos (A). (C,D) Live cldnb:gfp control (C) and MoAtoh1a-injected (D) embryos at 36 hpf. (E,F) The same embryos as in C,D imaged at 2.5 dpf, the number and position of neuromasts is within normal range. (G,H) Close-up view of a neuromast (red box in E,F), with hair cells labeled with FM4-64. Differentiated hair cells are present in wild type (red arrow) but absent in MoAtoh1a-injected embryos. (I,J) Loss of hair cells was confirmed by using an anti-acetylated tubulin antibody that labels the kinocilium (blue, blue arrow). (K,L) The primordium in embryos treated with 100 μm DAPT shows a normal pattern of neuromast deposition. (M,N) Primordia in DAPT and control embryos are indistinguishable. (O,P) The loss of restricted atoh1a expression in deposited neuromasts confirms the efficacy of DAPT treatment. Scale bars: 20 μm (unless otherwise stated). |
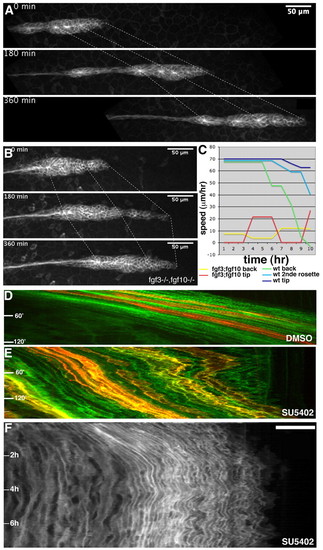
The primordium migrates in an uncoordinated manner in the absence of FGF activity. (A) Images from a time-lapse movie of wild-type migration, velocity 69 μm/hour. (B) Images from a time-lapse movie of a cldnb:gfp fgf3-/-;fgf10-/- embryo taken over 6 hours, showing the uncoordinated migration of the front and the back, average velocity 11 μm/hour. (C) Graph showing the speed of migration of tip (dark blue), the second rosette (blue) and the back (green) of the wild-type primordium, and of the tip (red) and the back (yellow) of the double mutant primordium, over a 10-hour period. (D) Kymograph of wild-type migration; all cells move at a similar speed, as indicated by the parallel lines of the kymograph. (E) Kymograph of a 3-hour movie of an SU5402-treated mosaic wt primordium showing the uncoordinated migration of cells within the primordium. (F) Kymograph of an 8-hour movie of a SU5402-treated wt primordium showing the back and forth movement of the primordium before it stops. |

FGF is required for rosette assembly, a prerequisite for primordium migration. Primordia of cxcr4b mutant embryos treated with DMSO (A) or SU5402 (B), showing the complete disappearance of rosettes after blocking the FGF pathway for 6 hours. (C,D) Time-lapse analysis and corresponding kymograph showing the progressive melting of rosettes after treatment with 80 μM SU5402. The migration speed is normal (70 μm/hour) and remains constant during this phase. Scale bar: 50 μm. (E,F) Time-lapse analysis and corresponding kymograph of a washout experiment showing that five rosettes (red arrows in E,F) simultaneously reassemble before migration resumes. Three phases can be distinguished on the kymograph: (1) uncoordinated migration, (2) rosette reassembly, and (3) migration recovery. (G,H) Expression of Fgf ligands in cldnb:gfp embryos treated for 6 hours with SU5402. Lower panels are transmission images of NBT/BCIP stainings. fgf3 (G) and fgf10 (H) are strongly expressed throughout the primordium when Fgfr is blocked. Scale bars: 20 μm (unless stated otherwise). |
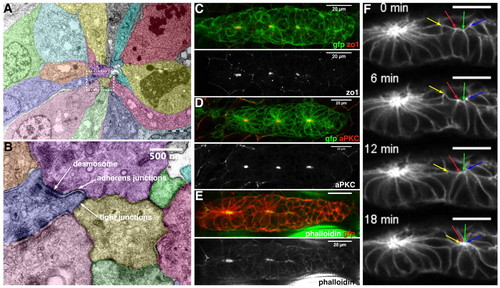
Rosettes are radial clusters of apically constricted epithelial cells. (A) Electron micrographs of an apical section of a rosette; false-colouring highlights individual cells. (B) Close-up of the centre of the rosette, corresponding to the framed area in A. (C-E) Immunostaining using antibodies against GFP and ZO-1 (C), GFP and aPKC (D), and GFP plus phalloidin staining (E). Tight junction protein ZO1 and aPKC are only expressed at the center of each rosette; phalloidin-labeling reveals enriched actin at centre of rosette. (F) Time-lapse analysis of wild-type rosette formation reveals a coordinated constriction of the apical surfaces of several cells. Arrows point to the vertices of these cells as they coalesce. Scale bars: 20 μm (unless stated otherwise). EXPRESSION / LABELING:
|

FGF signaling nucleates rosette assembly via a radial epithelialization process. (A-C) Immunostainings with GFP and ZO-1 antibodies in wild type (A), fgf3;fgf10 double mutants (B) and SU5402-treated embryos (C). Although ZO-1 is highly expressed in the centre of rosettes in wild-type primordia (arrows), it is completely absent from primordia lacking FGF activity. (D-H) Cells lacking FGF signaling are flatter and wider than control primordial cells. Confocal images show the primordium from the side in DMSO (D,F), and in SU5402 (E,G). F and G are close-up views of the boxed area in D and E; D and E are maximal projections, F and G are single z-planes. Red dashed lines outline single cell contour and the green star shows a rounded dividing cell (F,G). (H) Quantification of the cellular height:width ratio measured for 28 DMSO-treated (yellow) and 29 SU5402-treated (blue) cells from three different embryos in each case. This shows that cells deprived of FGF signaling have a rather cuboidal shape, whereas control cells have a columnar shape. (I-L) Confocal images of primordium showing single-cell behaviour in mosaic wild-type primordia exposed to DMSO (I,J) or to 5 μM SU5402 (K,L). Red and white arrows (J,L) point to lamellipodia and filopodia, respectively. (M-R) Global activation of fgf3 expression under the control of a heat-shock promoter. (M,N) fgf3 ISH 4 hours after heat shock of a sibling non-transgenic (M) and a hsp70:fgf3 (N) embryo. (O,P) Live pictures of a sibling (O) and hsp70:fgf3 (P) cldnb:gfp embryos 9 hours after heat shock. (Q,R) Quantification of the number of rosettes (Q) and the distance between the centre of the first rosette and the tip of the primordium (R) 9 hours after heat shock, showing that ectopic rosettes form in the leading region of the heat-shocked hsp70:fgf3 primordium. Scale bars: 20 μm (unless stated otherwise). |

Quantification of the number of rosettes in fgf3;fgf10 double mutant primordia at different time-points during lateral line development. At 28 hpf, all double mutant embryos show a complete absence of rosettes (blue bar, n=12), rather than the normal set of 3-4 that can be observed in wild type. However, the number of rosettes gradually increases, such that by 42 hpf almost half of the embryos display the normal number (green). |
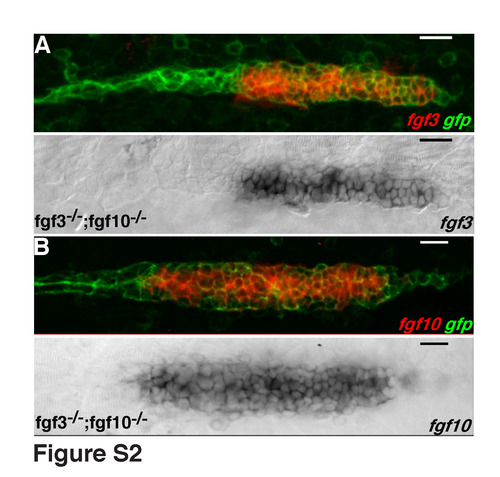
Expression of fgf ligands in fgf3;fgf10 double mutants. (A,B) The lower panels are transmission pictures, upper panels are merge of the GFP channel and the transmission channel after colour inversion (see Material and methods). fgf3 (A) and fgf10 (B) are expressed strongly and uniformly throughout the primordia. EXPRESSION / LABELING:
|
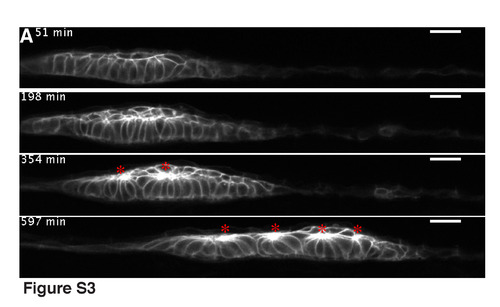
Time-lapse analysis showing epithelialized cells snapping together to form rosettes in the second phase of washout. The embryo was pre-treated with SU5402, washed for 5 hours and mounted side-on. Asterisks indicate the formed rosettes (see also Movie 7). |