
- Title
-
Notch resolves mixed neural identities in the zebrafish epiphysis
- Authors
- Cau, E., Quillien, A., and Blader, P.
- Source
- Full text @ Development
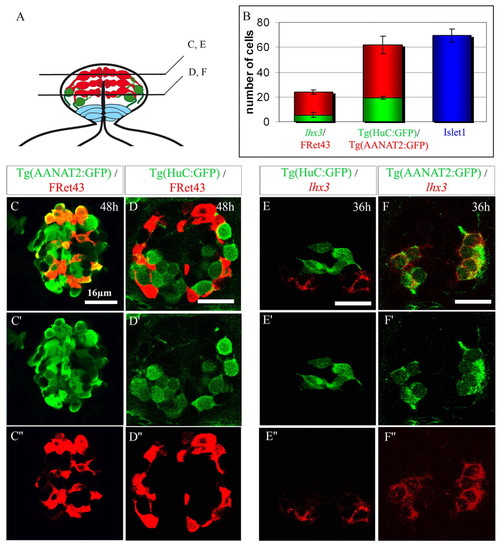
Characterization of the two categories of epiphysial neurons. (A) Schematic diagram of the epiphysial vesicle in frontal section. Dorsal is upwards. The photoreceptors (in red) lie dorsally and medially compared with the more ventrolateral projection neurons (in green). Ventrally located neuroepithelial cells are in light blue. (B) Average numbers of cells positive for markers of projection neurons (green) or photoreceptors (red) and total number of Islet1+ neurons (blue). A minimum of three embryos were analyzed for each stage. Error bars represent the standard deviation. (C-F″) Confocal sections of the epiphysis from Tg(AANAT2:GFP) (C-C″,E-E″) and Tg(HuC:GFP) transgenic embryos (D-D″,F-F″) labeled at 48 hours with the photoreceptor marker FRet43 or at 36 hours with the projection neurons marker lhx3. Anterior is upwards. Scale bars: 16 μm. |
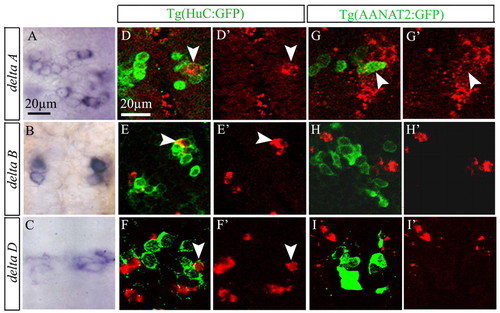
deltaB and deltaD are expressed specifically in projection neurons. (A-C) Dorsal view of epiphysis, showing expression of deltaA, deltaB and deltaD in wild-type embryos at 18 hours. (D-F′) Confocal section of the epiphysis, showing expression of deltaA, deltaB and deltaD (red) in Tg(HuC:GFP) embryos at 24 hours. (G-I′) Confocal section of the epiphysis, showing expression of deltaA, deltaB and deltaD (red) in Tg(AANAT2:GFP) embryos at 24 hours. Anterior is upwards. Scale bars: 20 μm. White arrowheads indicate double-labeled cells. EXPRESSION / LABELING:
|
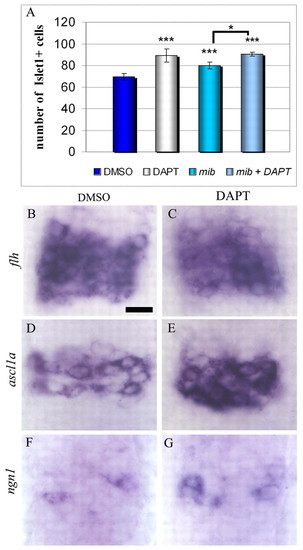
Increased production of neurons in mib and DAPT-treated embryos. (A) Average numbers of Islet1+ cells in the epiphysis of mock-treated embryos, mib mutant and DAPT-treated embryos at 48 hours. (B-G) Dorsal view of epiphysis, showing expression of flh, ascl1a and ngn1 in mock or DAPT-treated embryos at 16 hours. Error bars represent the standard deviation. *P<0.05; ***P<0.0005 using a t-test. Scale bar: 10 μm. Anterior is upwards. EXPRESSION / LABELING:
PHENOTYPE:
|
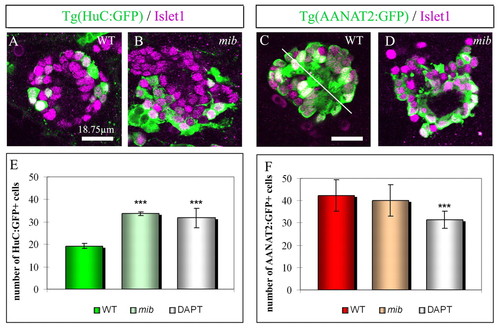
Modification of neuronal subtype identity in mib and DAPT-treated embryos. (A,B) Expression of GFP (green) and Islet1 (purple) in wild-type (WT) and mib;Tg(HuC:GFP) transgenic embryos at 48 hours. As Tg(HuC:GFP) labels other structures close to the epiphysis and as the epithalamus of mib embryos is highly disorganized, Islet1 serves to identify epiphysial neurons. (C,D) Expression of GFP (green) in Tg(AANAT2:GFP) transgenic embryos shown as confocal sections with Islet1 (purple). In wild-type embryos, Tg(AANAT2:GFP)+ photoreceptors are arranged in two mirror-imaged rows with the outer segments of the cells located at the midline (white line), this stereotyped organization is lost in mib embryos. Scale bars: 18.75 μm. (E,F) Average numbers of GFP+ cells (green) in Tg(HuC:GFP) (E) or in Tg(AANAT2:GFP) embryos (F) in the epiphysis of wild-type, mib or DAPT-treated embryos at 48 hours. Anterior is upwards. Error bars represent the standard deviation *P<0.05; ***P<0.0005 using a t-test. EXPRESSION / LABELING:
|

Impaired photoreceptor/projection neurons ratio in embryos deficient for Delta genes. (A-B′) Confocal sections from wild-type (A-A′) and deltaA-/-, deltaD-morphant epiphysis (B-B′) showing GFP from Tg(HuC:GFP) (green), FRet43 (red) and Islet1 (purple) at 48 hours of development. (C-G)Average number of Islet1+ (C), HuC/D+ (D), Tg(HuC:GFP)+ (E), FRet43+ (F) and Tg(AANAT2:GFP)+ cells (G) in 48 hours embryos depleted for the function of deltaA and/or deltaD. Anterior is upwards. Scale bar: 16 μm. Error bars represent the standard deviation ***P<0.0005 using a t-test. EXPRESSION / LABELING:
|
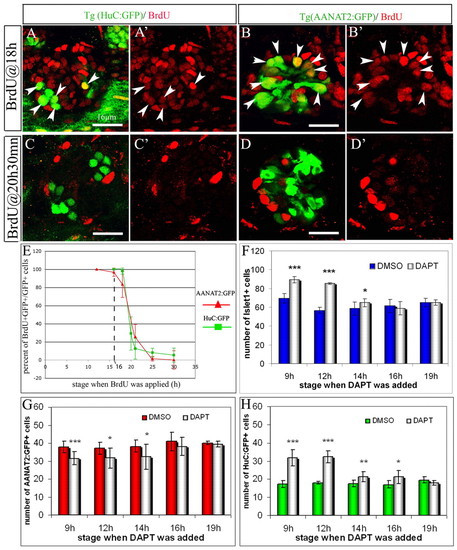
The photoreceptors and the projection neurons are born simultaneously and Notch activity is required in cycling progenitors. (A-D′) Co-labeling of BrdU (red) with either Tg(HuC:GFP) (A,C) or Tg(AANAT2:GFP) (B,D) in 48-hour-old embryos that have been subjected to a 2-hour BrdU-pulse starting at 18 hours (A-B′) or 20.5 hours (C-D′). White arrowheads indicate double-labeled cells. (E) Proportion of BrdU+;GFP+ cells over total number of GFP+ cells after a 2-hour pulse of BrdU. Embryos transgenic for Tg(HuC:GFP) or Tg(AANAT2:GFP) were subjected to a pulse of BrdU starting from various stages. The percent of BrdU+ cells was evaluated at 48 hours. (F-H) Average numbers of Islet1+ neurons, Tg(AANAT2:GFP)+ and Tg(HuC:GFP)+ cells in the epiphysis of DMSO and DAPT-treated embryos. The x-axis indicates the stage at which the treatment starts. Anterior is upwards. Scale bars: 16 μm. Error bars represent s.d. *P<0.05; **P<0.001; ***P<0.0005 using a t-test. |
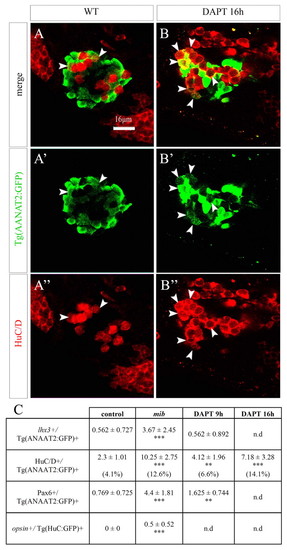
Role for Notch in the resolution of a mixed identity. (A-B″) Confocal sections of Tg(AANAT2:GFP) embryos at 48 hours, stained with a HuC/D antibody. Embryos were either mock treated (A-A″) or DAPT treated (B-B″) from 16 hours. Anterior is upwards. White arrowheads indicate double-labeled cells. (C) Average numbers of cells double-labeled for various projection neuron/photoreceptor marker combinations. In the case of HuC/D/Tg(AANAT2:GFP) + cells, the percent of double-labeled cells was calculated over the total number of cells expressing either marker. Numbers indicate average±s.d. **P<0.001; ***P<0.0005 using a t-test. nd, not determined. EXPRESSION / LABELING:
|
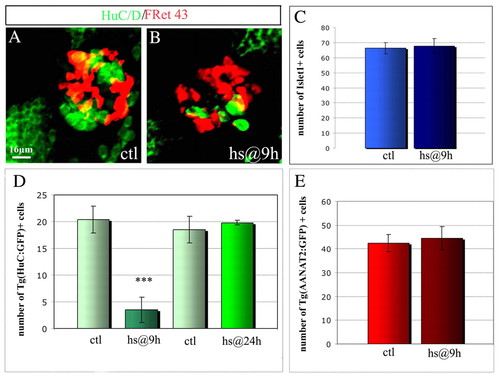
Repression of projection neuron identity upon constitutive activation of Notch. (A,B) Confocal projections of a control (A) and a Tg(hs:Gal4); Tg(UAS-Nintra) double transgenic (B) embryo 48 hours after a heat shock performed at 9 hours (B). Cells are labeled with HuC/D and with FRet43. (C-E) Average numbers of Islet1+ cells (C), Tg(HuC:GFP)+ (D) and Tg(AANAT2:GFP)+ cells (E) at 48 hours in control and Tg(hs:Gal4); Tg(UAS-Nintra) double transgenic embryos heat shocked at 9 or 24 hours. As the constitutive expression of Notch intra impairs the formation (or the migration) of the parapineal organ, which originates from the epiphysis (Concha et al., 2003), we counted the total numbers of Islet1+ in epiphysis and parapineal in the control embryos. Scale bar: 16 μm. Error bars represent s.d. *P<0.05; ***P<0.0005 using a t-test. |

(A-A′) Optical sections of Tg(AANAT2:GFP) epiphysis at 2 days of development stained with a triple red opsin, exorhodopsin, rhodopsin probe and GFP. All opsin-positive cells are Tg(AANAT2:GFP)+; conversely, only 87.2±4.14% of Tg(AANAT2:GFP)+ cells are positive for one of the three opsins. (B-C′) Optical sections of Tg(HuC:GFP) (B,B′) and Tg(AANAT2:GFP) (C,C′) epiphyses at 48 hours labelled with a Pax6 antibody and GFP. Tg(HuC:GFP)+ cells are also positive for Pax6 (blue arrowheads). Numerous Pax6+, Tg(HuC:GFP)- neuroepithelial cells are observed in the ventrolateral part of the epiphysial area (white arrowheads). Pax6 and Tg(AANAT2:GFP) expression is mostly exclusive except for rare cells expressing both markers (blue arrowheads). |
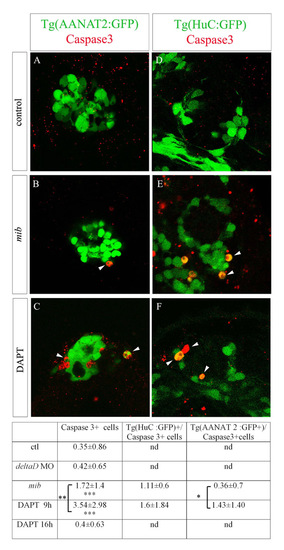
(A-F) Confocal sections of Tg(AANAT2:GFP) (A-C) and Tg(HuC:GFP) (D-F) epiphysis stained with a caspase 3 antibody and GFP in wild-type (A), mib mutant (B) and DAPT-treated embryos (C) at 48 hours of development. The number of apoptotic cells is increased in mib mutant compared with wild-type embryos and in DAPT-treated embryos compared with mib mutants. (G) Counts of caspase 3+ cells, Tg(HuC:GFP)+/caspase 3+ and Tg(AANAT2:GFP)+/caspase 3+ cells. Numbers indicate average±s.d. *P<0.05; **P<0.001; ***P<0.0005 using a t-test. nd, not determined. |