
- Title
-
In vivo time-lapse imaging delineates the zebrafish pituitary proopiomelanocortin lineage boundary regulated by FGF3 signal
- Authors
- Liu, N.A., Ren, M., Song, J., Ríos, Y., Wawrowsky, K., Ben-Shlomo, A., Lin, S., and Melmed, S.
- Source
- Full text @ Dev. Biol.
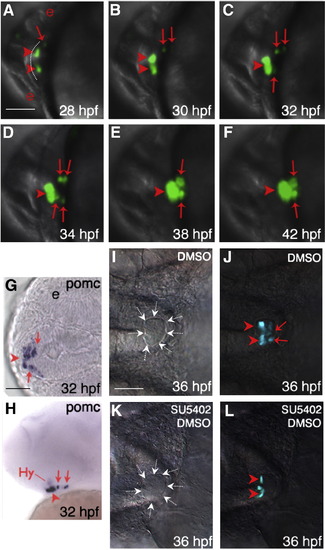
Temporally and spatially distinct POMC cell ontogeny in zebrafish pituitary. (A–F) In vivo time-lapse imaging of POMC-GFP expressing-cells in the pituitary anlage visualized using a Leica TCS SP confocal microscope from 28 to 42 hpf. Developmental stages are indicated at bottom right corner. POMC-GFP expressing cells are detected within the anterior most and lateral-posterior surface of ANR at 28 hpf (A), followed by asymmetric bilateral-posterior POMC cell differentiation and medio-posterior migration into the rostral pars distalis (RPD) and pars intermedia (PI). (G and H) in situ hybridization at 32 hpf using a POMC probe. Note the endogenous pituitary pomc expression pattern is similar to that of POMC-GFP transgene. (I–L) Treatment of POMC-GFP transgenic embryo with 10 μM SU5402 or DMSO between 22–26 hpf leads to diminished POMC-GFP cells in PI by 36 hpf visualized under a fluorescein isothiocyanate (FITC) filter on a Zeiss microscope. (I and K), DIC images showing pituitary anlage outlined by dashed arrows. (J and L), POMC-GFP fluorescent images superimposed onto DIC images. A–F and I–L: ventral view; G: ventral–frontal view; H: ventrolateral view (top, dorsal; bottom, ventral). All: left, anterior; right, posterior. Arrowhead: anterior-most or RPD POMC cells; arrow: lateral-posterior or PI POMC cells; Hy: hypothalamic POMC expressing cells. The anterior-most neural ridge surface is traced as a reference point in panel A. e, eye. Scale bars, 50 μm. |
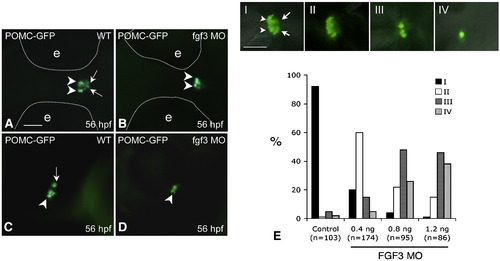
FGF3 dose-dependent regulation of POMC expression in the RPD and PI of zebrafish pituitary. 1–2 cell stage POMC-GFP transgenic embryos were injected with vehicle (A and C) or 0.4 ng/embryo of FGF3 MO (B and D) and then cultured in routine medium. At 56 hpf, POMC-GFP expression patterns were analyzed using fluorescent microscopy. For quantification, POMC-GFP transgenic embryos injected with 1 nL of FGF3 MO at increasing concentrations or 1.2 ng/embryo standard control MO were characterized under fluorescent microscopy and devided into 4 subgroups (E, I–IV) according to pituitary POMC-GFP phenotypes: Phenotype I, normal POMC-GFP expression in both the rostral pars distalis (arrowheads) and pars intermedia (arrow); Phenotype II, loss of POMC-GFP expression in the pars intermedia; Phenotype III, loss of POMC-GFP expression in the pars intermedia and partial loss in the rostral pars distalis (< 50% loss in pars distalis compared to I); Phenotype IV, loss of POMC-GFP expression in pars intermedia and rostral pars distalis (> 50% loss in pars distalis compared to panel I). Frequencies (%) of each phenotype corresponding to injections of standard control MO (1.2 ng) or FGF3 MO (0.4 ng, 0.8 ng or 1.2 ng) are analyzed and shown in panel E. Data are collected from two independent experiments. n, number of analyzed embryos. A–D: ventral view. left, anterior; right, posterior. Scale bar, 50 μm. |
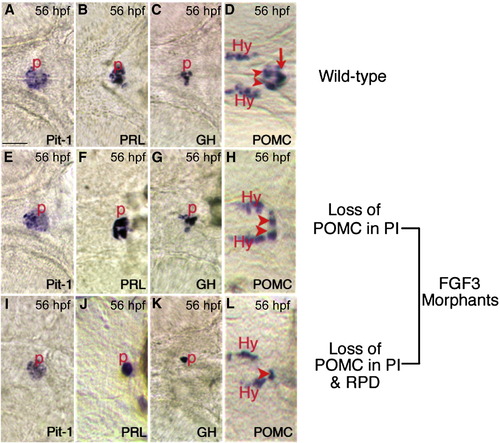
Expression of Prl, Gh, and Pit-1 in FGF3 morphants are intact. In situ hybridization at 56 hpf using probes indicated in the lower right corner of each panel. (A–D) Wild type embryos. (E–H) Low dose FGF3 morphants with diminished POMC-GFP expression in the pars intermedia. (I–L) High dose FGF3 morphants with diminished POMC-GFP expression in the pars intermedia and rostral pars distalis. Ventral view of head, anterior to the left. Arrowheads, RPD. Arrow, PI. P, pituitary; Hy, hypothalamic POMC cells. Scale bar, 50 μm. |
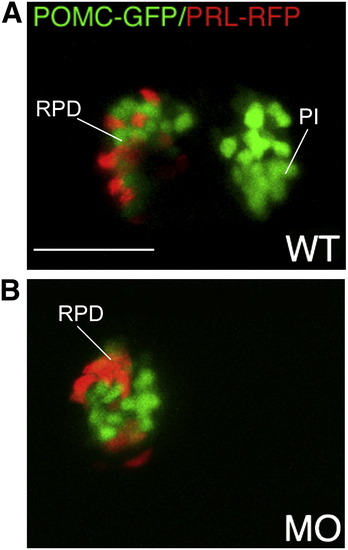
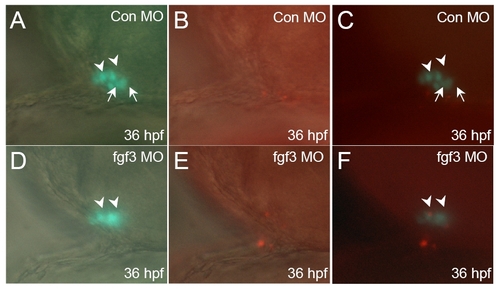
Lineage specific suppression of PI POMC cells in FGF3 morphants. 1–2 cell stage POMC-GFP/PRL-RFP double transgenic embryos were either injected with 0.4 ng of FGF3 MO (B) or vehicle (A) and then cultured in routine medium. At 56 hpf, pituitary POMC-GFP/PRL-RFP expression patterns were analyzed in live embryos using confocal microscopy. In FGF3 morphant, POMC-GFP expressing cells are detected within the rostral pars distalis but not in the pars intermedia, whereas PRL-RFP expression is intact. Ventral pituitary view under high magnification (63x), anterior to the left. WT, wild type; MO, FGF3 morphant. RPD, rostral pars distalis; PI, pars intermedia. Scale bar, 50 μm. |
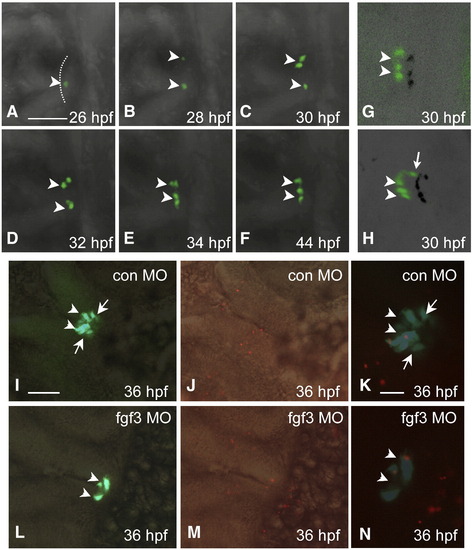
Loss of POMC cells in the pars intermedia of FGF3 morphants is associated with absent lineage induction. Developmental stages are indicated at bottom right corner. (A–F) In vivo time-lapse imaging of POMC-GFP expressing-cells in the pituitary anlage of an FGF3 morphant from 26 to 44 hpf. POMC-GFP expressing cells are detected within the anterior-most ANR surface but not the lateral–posterior areas during the entire process. (G and H) 3-D confocal microscopy image of POMC-GFP expressing-cells with shadow projections (black signals). The 3-D image further confirms lack of lateral-posterior POMC cells in the FGF3 morphant (G) compared with wild type embryos (H) at 30 hpf. (I–N) POMC-GFP cell apoptosis is unaffected in hypomorphic FGF3 morphants. DIC images of pituitary ventral views superimposed with fluorescent images of POMC-GFP (I and L), or TMR Red labeling of apoptotic cells in red (J and M). Fluorescent images of POMC-GFP superimposed with TMR Red cell labeling in red show occasional pituitary apoptotic cells in embryos injected with standard control MO (K) or FGF3 MO (N). Scale bar (A–J, L, M), 50 μm. (K and N), 20 μm. All ventral-frontal view; left, anterior; arrowhead: anterior-most POMC cells in ANR; arrow: lateral–posterior POMC cells. The anterior-most neural ridge surface is traced as a reference point in panel A. |

Hypomorphic FGF3 morphants exhibit intact Lim3 expression at 32 hpf. 1–2 cell stage POMC-GFP transgenic embryos were injected with either 0.4 ng/embryo standard control MO (E and G) or FGF3 MO (F and H) and then cultured in routine medium. At 32 hpf, Lim3 in situ hybridization was performed. E and F: frontal view; left, top. G, H: lateral view; left, anterior; right, posterior. p, pituitary; h, heart. Scale bar, 50 μm. EXPRESSION / LABELING:
|
Hypomorphic fgf3 knock down do not inhibit POMC-GFP cell proliferation. Developmental stages are indicated at bottom right corner of each panel. (A-C) standard control MO injection. (D-F) fgf3 MO injection. DIC images of pituitary ventral-lateral views superimposed with fluorescent images of POMC-GFP expression (A and D), or BrdU immunostain in red (B and E). Fluorescent images of POMC-GFP superimposed with BrdU labeled cell in red show no inhibition of POMC-GFP cell proliferation in hypomorphic FGF3 morphants (F) compared with embryos injected with standard control MO (C) . Scale bar, 50 μm. All ventral-lateral view; top, anterior; right, dorsal; arrowhead: anterior-most POMC cells; arrow: lateral-posterior POMC cells. EXPRESSION / LABELING:
|
Reprinted from Developmental Biology, 319(2), Liu, N.A., Ren, M., Song, J., Ríos, Y., Wawrowsky, K., Ben-Shlomo, A., Lin, S., and Melmed, S., In vivo time-lapse imaging delineates the zebrafish pituitary proopiomelanocortin lineage boundary regulated by FGF3 signal, 192-200, Copyright (2008) with permission from Elsevier. Full text @ Dev. Biol.