
- Title
-
Live Imaging of Neuronal Degradation by Microglia Reveals a Role for v0-ATPase a1 in Phagosomal Fusion In Vivo
- Authors
- Peri, F., and Nüsslein-Volhard, C.
- Source
- Full text @ Cell

Microglia in the Zebrafish Brain (A and B) Dorsal views of a 3 dpf (days post fertilization) embryonic wild-type brain. (A) Microglial expression of the Apo-E mRNA. (B) GFP expression under the control of the Apo-E locus. (C) Schematic drawings of the regions of interest. Anterior is to the left. The upper panel represents a side view of a 3 dpf fish. The red bar marks the region and the depth at which confocal imaging has been performed. The lower part represents a dorsal view of the examined area (light red). The optic lobes are marked in dark red. (D–F) Dorsal view of a 3 dpf wild-type embryonic brain. Double antibody (green [D]) and in situ (red [E]) staining show a perfect overlap between GFP and apo-E expression (F). (G) Confocal time-lapse of one branching Apo-E wild-type microglial cell. Time is indicated in minutes. EXPRESSION / LABELING:
|
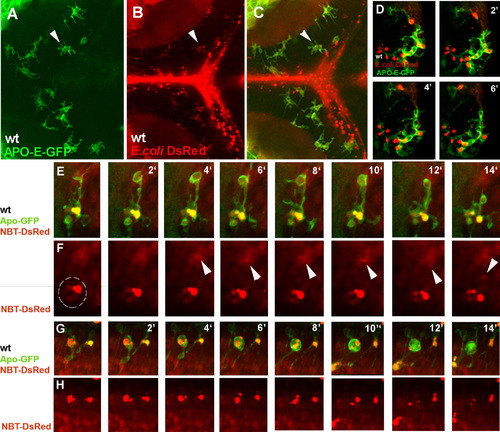
Microglia Phagocytose E. coli Bacteria and Neurons in the Brain (A–C) Dorsal views of a 3 dpf (days post fertilization) embryonic wild-type brain. (A) Microglial labeled by Apo-E-GFP. (B) Red-labeled Gram-negative E.coli bacteria (DsRed Express, Clontech). (C) Merge. Red bacterial inclusions are present inside the microglia (white arrowhead). (D) Confocal time-lapse of one Apo-E-GFP wild-type microglial cell collecting a red-labeled bacterial cluster (white arrowheads). (E–H) Confocal time-lapse of one branching Apo-E-GFP wild-type microglial cell collecting (E) and (F) and digesting (G) and (H) NBT-DsRed neurons. Time is indicated in minutes. White arrowheads point to the neuronal material being collected by a phagosome, the dotted line encircles the neuronal material inside the microglia (F). EXPRESSION / LABELING:
|
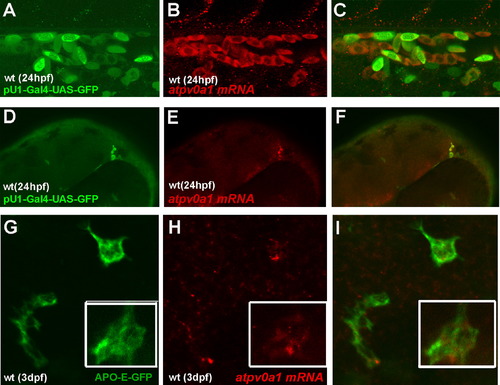
v0-ATPase a1 Expression in Macrophages and Microglia of the Zebrafish Embryo (A–C) Side view of the wild-type fish trunk at 1 dpf (day post fertilization). (A) pU1-Gal4-UAS-GFP labels the myeloid lineage in green. (B) atp6v0a1 expression in red (C) Merge. (D–F) Side view of the wild-type fish head at 1 dpf (days post fertilization). (D) pU1-Gal4-UAS-GFP labels the myeloid lineage in green. (E) atp6v0a1 expression is in red. (F) Merge. (G–I) Dorsal view of the wild-type fish head at 3 dpf (days post fertilization). (G) Apo-E-GFP labels microglial cells in green. (H) atp6v0a1 expression in red (I) Merge. In the bottom right corner is an enlargement of an APO-E-positive cell expressing atp6v0a1 mRNA. EXPRESSION / LABELING:
|

Accumulation of Apoptotic Neuronal Material in v0-ATPase a1 Knocked-Down Microglia (A and B) Apo-E-expressing cells have a myeloid origin. Dorsal view of the wild-type fish head at 3 dpf (days post fertilization). (A) apo-E mRNA expression in the wild-type embryo. (B) apo-E mRNA is not detectable in embryos injected with a morpholino directed against the pU1 transcription factor, whose activity is required for myeloid cells specification. (C and D) Dorsal view of the wild-type fish head at 3 dpf (days post fertilization). Acridine orange stainings detect apoptosis in the CNS. Levels of apoptosis within the CNS are comparable in wild-type (C) and atp6v0a1-MO embryos (D). (E) Quantification of the number of apoptotic clusters per embryo. The values are comparable between wild-type, atp6v0a1-MO and Bafilomycin-A1 treated microglia. The data represent the average ± SD of ten independent experiments. (F) Quantification of the apoptotic cluster size. Apoptotic foci in atp6v0a1-MO embryos are three times larger then in the wild-type. These values were obtained by counting the number of red vesicles per cluster in different experiments. The data represent the average ± SD of ten independent experiments. (G) Western blotting analysis using a polyclonal antibody directed against v0-ATpase a1. This shows that the expected 116kDa band, presents in extracts of 3 dpf uninjected embryos, is absent in extracts obtained from atp6v0a1 3 dpf knockdown embryos. This confirms the efficacy of the morpholino mediated knockdown. (H–K) Dorsal view of the wild-type fish head at 3 dpf (days post fertilization). Foci of apoptotic neurons are found inside wild-type microglia. (H) Apo-E-GFP expression. (I) NBT-dSRed expression. (J) AnnexinV-Cy5 labeling of apoptotic clusters. (K) Merge. White arrowhead points at one single apoptotic neuronal cluster. (L–O) Dorsal view of the fish head at 3 dpf (days post fertilization) in atpv0a1 morpholino injected embryos. Foci of apoptotic neurons are larger then in wild-type. (L) Apo-E-GFP expression. (M) NBTdSRed expression. (N) AnnexinV-Cy5 labeling of apoptotic clusters. (O) Merge. White arrowhead points at one single apoptotic neuronal cluster. The size of the cluster is larger when compared to the wild-type. EXPRESSION / LABELING:
PHENOTYPE:
|

v0-ATPase a1 Knocked-Down Microglia Are Unable to Digest Apoptotic Neurons, However Vesicular Acidification Is Not Effected (A and B) Two time points (0 and 210 min) of confocal time-lapse of one APO-E-GFP wild-type microglial cell containing apoptotic material labeled by AnnexinV-Cy5 binding. Time is in minutes. (A′ and B′) AnnexinV-Cy5 labeling in the same microglial cell. (C and D) Two time points (0 and 210 min) of confocal time-lapse of one APO-E-GFP v0-ATPase a1 knocked-down microglial cell containing the apoptotic material labeled by AnnexinV-Cy5 binding. Time is in minutes. (C′ and D′) Confocal time-lapse of AnnexinV-Cy5 labeling in the same microglial cell. (E) Quantification of fluorescent intensity emission values at 670 nm (AnnexinV-Cy5) in wild-type microglia (green bars) and atp6v0a1 knocked-down microglia (purple bars). Error bars indicate standard deviation. Over time, AnnexinV-Cy5 staining disappears only from wild-type embryos. The data represent the average ± SD of four independent experiments. (F) We have measured fluorescent intensity values at 505nm (LysoSensor) in several wild-type vesicular clusters. (G–I) Dorsal views of a 3 dpf (days post fertilization) embryonic wild-type brain. (G) LysoSensor. (H) NBT-DsRed. (I) Merge. There is partial colocalization between acidic vesicles (green) and apoptotic cluster (red). (J–L) Dorsal views of a 3 dpf (days post fertilization) embryonic v0-ATPase-a1 knocked-down brain. (J) LysoSensor. (K) NBT-DsRed. (L) Merge. Acidic vesicles can be detected in v0-ATPase a1 knocked-down and they colocalize with the neuronal apoptotic clusters. (M–O) Dorsal views of a 3 dpf (days post fertilization) embryonic wild-type brain treated with Bafilomycin A1. (M) LysoSensor. (N) NBT-DsRed. (O) Merge. After Bafilomycin A1 treatment vesicles are no longer acidic and are not labeled by the LysoSensor. (P) and (Q) Examples of wild-type (P) and atpv0a1-MO (Q) acidic vesicular clusters, (purple circle [P]) and in atpv0a1-MO (yellow circle [Q]). We have also measured background fluorescent emission at 505nm in wild-type (purple square [P]) and in atpv0a1-MO (yellow square [Q]). Values from several different experiments have been plotted. Error bars indicate standard deviation. EXPRESSION / LABELING:
PHENOTYPE:
|

Time-Lapse Analysis of Vesicular Fusion Events (A–D) Colocalization of the genetically encoded lysosomal marker CD63/Lamp-GFP3 (I) with the lysosomal membrane permeable dyes MR-Cathepsin (J) and DQ-BSA (K). In the bottom left corner an enlargement is presented. (E) Confocal time-lapse of a single wild-type APO-GFP microglia and NBT DsRed neurons. Phagosomes of different intensity containing apoptotic neuronal material fuse (white arrowheads). Fusion is visible due to the spreading of dye from one vesicle into the other. Time is in minutes. (F and G) Confocal time-lapse of a single wild-type APO-GFP microglia and NBT DsRed neurons. The cell branches out to collect neuronal material and a new phagosome forms (white arrowhead). (H–K) The same cell as in (F). APO-GFP (H). NBT-DsRed (I). DQ-BSA (J). Merge (K). The newly formed vesicle is a phagosome and it is not yet labeled by the DQ-BSA dye. (L) Confocal time-lapse of a single wild-type APO-GFP microglia whose lysosomes are labeled in red by MR-chatepsin. The yellow arrowhead points at a fusion event between a lysososme (red) and a phagosome (green). Time is in minutes. |
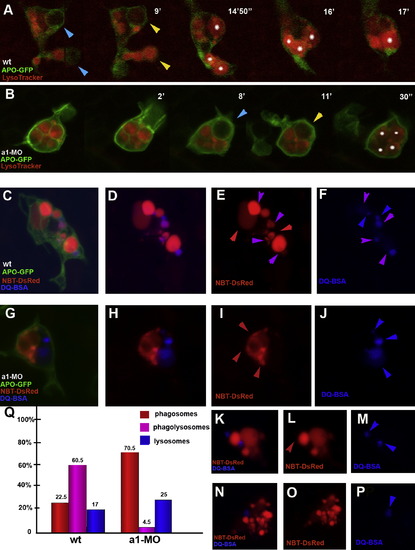
Phagolysosomal Fusion Defects in atp6v0a1 Morpholino Knock-Down (A) Confocal time-lapse analysis of wild-type (A) and atp6v0a1-MO microglia (B) microglia in 3 dpf brains. Time is indicated in minutes and seconds. Microglia are in green marked by GFP expression (Apo-E-GFP) while acidic endocytotic vesicles are marked in red by the LysoTracker. Blue arrowheads mark the formation of phagosomes. Yellow arrowheads mark phagosomal acidification (the vesicle turns red). White asterisks label single acidic vesicles. Fusion between acidic phagosomes is only observed in wild-type. (C–P) Heterotypic vesicular fusion in wild-type (C–F) and in atp6v0a1-MO microglia (G–P). (E, I, L, and O) NBT-DsRed labeling of phagosomes and phagolysosomes. (F, J, M, and P) DQ-BSA labeling of lysosomes and phagolysosomes. (D, H, K, and N). Merge. Phagosomes are marked by red arrowhead, lysosomes by blue arrowheads and phagolysosomes by purple arrowheads. Phagolysosomes (purple) are only observed in the wild-type (C and D). (Q) Percentage of the number of phagosomes (red bars), lysosomes (blue bars) and phagolysosomes (purple bars) present in wild-type (n = 15) and morphant cells (n = 15). PHENOTYPE:
|
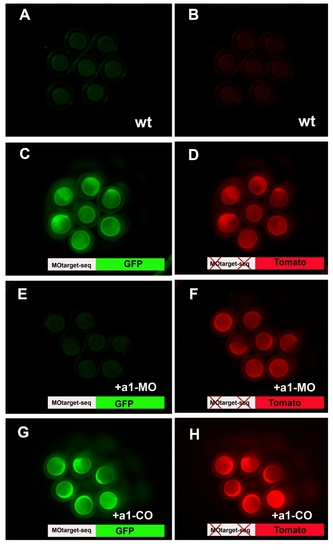
The a1MO binds to its target sequence |
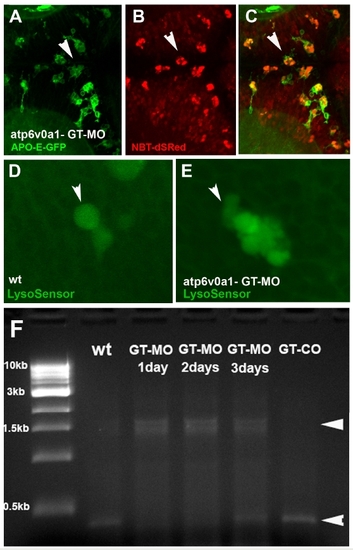
GT-MO injected embryos display a phenotype that is comparable with that observed for ATG-MO injected embryos EXPRESSION / LABELING:
PHENOTYPE:
|
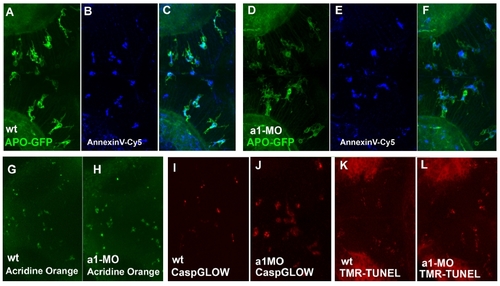
Analysis of apoptosis in wild-type and morphant embryos EXPRESSION / LABELING:
PHENOTYPE:
|
Reprinted from Cell, 133(5), Peri, F., and Nüsslein-Volhard, C., Live Imaging of Neuronal Degradation by Microglia Reveals a Role for v0-ATPase a1 in Phagosomal Fusion In Vivo, 916-927, Copyright (2008) with permission from Elsevier. Full text @ Cell