
- Title
-
The eye organizes neural crest cell migration
- Authors
- Langenberg, T., Kahana, A., Wszalek, J.A., and Halloran, M.C.
- Source
- Full text @ Dev. Dyn.
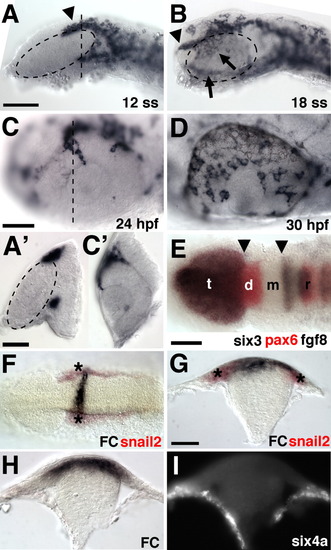
Anterior neural crest localization and uncaging method. A-D: In situ hybridization for crestin at the indicated stages. Anterior is to the left, dorsal is up. A′ and C′ are cross-sections of A and C, respectively, sectioned at the dotted lines. Arrowheads point to the dorsal anterior stream of neural crest cells (NCCs), arrows to the medial and ventral populations. The hatched oval outlines the eye. E: Double in situ hybridization for the indicated genes. Dorsal view, anterior to the left. Arrowheads mark the boundaries of the regions uncaged for fate mapping. t, telencephalon; d, diencephalon; m, mesencephalon; r, rhombencephalon. F-I: Controls showing that NCCs and not lateral plate mesoderm were uncaged. Uncaged fluorescein (FC) stained black. F,G: Dorsal view (F) and (G) cross-section (G) showing uncaged fluorescein (black) and snail2 expressing NCCs (red, asterisks). I: Fluorescent in situ hybridization for six4a, which is masked by the bright background in H. G-I are cross-sections. Scale bars = 100 μm in A,B, 50 μm in C,D, 25 μm in A′,C′, 100 μm in E,F, 50 μm in G-I. EXPRESSION / LABELING:
|
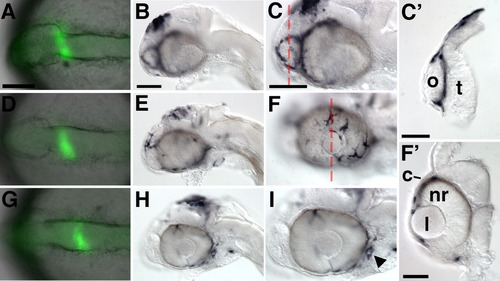
Fate mapping of diencephalic and mesencephalic neural crest cells (NCCs). A,D,G: Live embryos at 6- to 8-somite stage (ss), immediately after uncaging, showing overlay of brightfield and uncaged fluorescein (green). Fluorescent signal is enhanced to stand out against background. Dorsal views, anterior to the left. B,C,E,F,H,I: Embryos at 36 hours postfertilization (hpf), labeled with anti-fluorescein antibody. Except for C′ and F′ all images are lateral views, anterior to the left. A-C,C′: Diencephalic label. C′: Cross-section through the telencephalon and olfactory placode (o) of the embryo in C. D-F: Mesencephalic label. F′: Cross-section through one eye of the embryo in F. Fluorescein positive NCCs are located between the corneal epithelium (c) and the neural retina (nr). G-I: Posterior mesencephalic label. NCCs in BA1 are marked by the arrowhead. c, corneal epithelium; l, lens; nr, neural retina; o, olfactory placode; t, telencephalon. Scale bars = 100 μm in A,D,G, 100 μm in B,E,H, 50 μm in C,F,I. |

Neural crest cells (NCCs) in chokh embryos. A-F: Wild-type (WT) and chokh mutant embryos labeled with in situ hybridization for NC markers at the indicated stages. Arrowheads mark normal (A-C,C′,E′) and missing (D,D′,F′) NCC populations. The hatched circle marks the eye in WT embryos (C,E) and the approximate position where the eye would normally have developed in chokh embryos (D,F). A, B are dorsal, C-F lateral views, anterior to the left. C′-F′: Cross-sections through the eye vesicle in WT and the respective region in chokh embryos. Scale bar = 100 μm in A-F, 50 μm in C′-F′. lr, lens remnant. EXPRESSION / LABELING:
|
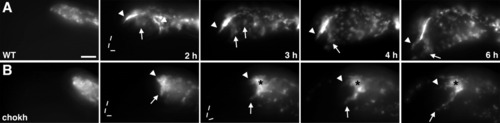
Anterior neural crest cells (NCCs) have defective migration in chokh. A,B: Stills from time-lapse movies of a wild-type (WT, A) and a chokh mutant (B) embryo in the Tg(sox10:gfp) background. Images are a selection of maximum projections of stacks acquired every 5 min in a time-lapse. All images are lateral views with anterior to the left and dorsal up. In some panels, the tip of the embryo is marked by hatched lines. Arrowheads point to the dorsal anterior population of NCCs, arrows to the medial. The asterisk marks the mass of nonmigrating NCCs in chokh embryos. Scale bar = 100 μm. EXPRESSION / LABELING:
PHENOTYPE:
|
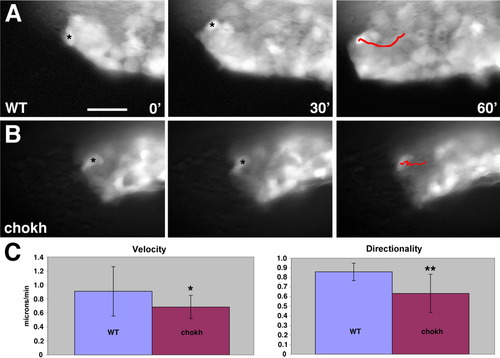
Anterior neural crest cells (NCCs) have reduced migration rates and directionality in chokh. A,B: Stills from time-lapse movies at higher magnification of a wild-type (WT, A) and a chokh mutant embryo (B) in the Tg(sox10:gfp) background. Red lines in 60-min panels show the tracking position at each 2-min interval of the cells marked by asterisks in the 0-min and 30-min panels. C: Results of velocity and directionality measurements. Cells were tracked over 20 to 60 min. Values shown are the mean, and error bars are standard deviation. n = 21 cells in 5 embryos for WT and 26 cells in 5 embryos for chokh embryos. Means were compared with unpaired t-tests. *P = 0.0061; **P < 0.0001. Scale bar = 50 μm. EXPRESSION / LABELING:
|
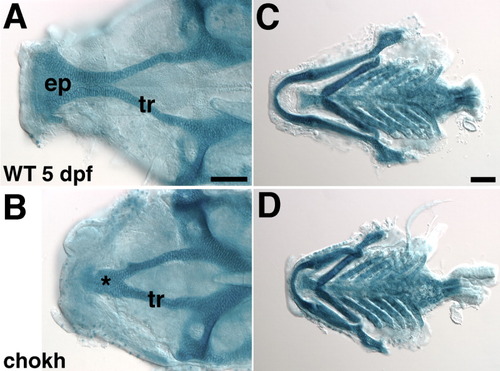
Cranial cartilages are affected in chokh mutant embryos. A-D: Alcian blue stained wild-type (WT) and chokh mutant dissected neurocranium (A,B) and lower jaw (C,D) at 5 days postfertilization (dpf). Ventral views, anterior is to the left. Scale bars = 25 μm in A,B, 100 μm in C,D. PHENOTYPE:
|