
- Title
-
Genetic and Physiologic Dissection of the Vertebrate Cardiac Conduction System
- Authors
- Chi, N.C., Shaw, R.M., Jungblut, B., Huisken, J., Ferrer, T., Arnaout, R., Scott, I., Beis, D., Xiao, T., Baier, H., Jan, L.Y., Tristani-Firouzi, M., and Stainier, D.Y.
- Source
- Full text @ PLoS Biol.
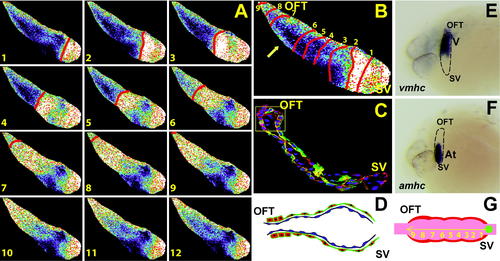
Cellular and In Vivo Electrophysiologic Analysis of 24 hpf Wild-Type Hearts (B) A 24 hpf optical map of calcium excitation represented by isochronal lines every 60 ms. Slow linear conduction with no significant delays is observed across the 24 hpf heart tube with increased conduction velocity over the presumptive ventricle (arrow). (C) Tg(cmlc2:eGFP-ras)s883 (green) embryos at 24 hpf are stained with rhodamine phalloidin (red) and TOPRO (dark blue). The heart is a linear tube, and cardiomyocytes uniformly have a squamous shape except at the OFT (yellow box) where they have become cuboidal. (D) Schematic representation of the heart shown in (C). Myocardium is in red. Endocardium is in blue. (E and F) In situ analysis of 24 hpf embryos reveals molecular chamber specification within the heart tube: atrial myosin heavy chain, amhc, and ventricular myosin heavy chain, vmhc. Lateral views. (G) Schematic representation of conduction in 24 hpf heart. Numbers indicate temporal sequence of calcium activation in the heart. Yellow arrow indicates direction of cardiac conduction. Green circle indicates slow conduction pathway/pacemaker activity. SV, sinus venosus; V, ventricle; At, atrium. |
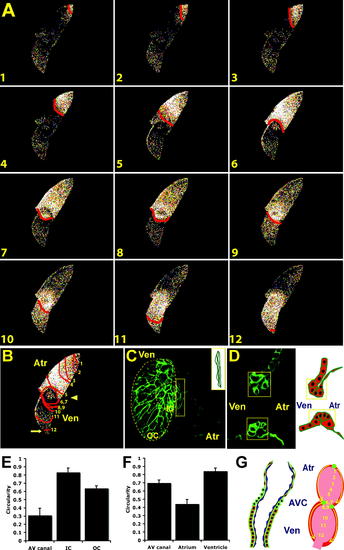
Development of AV Myocardium Results in AV Conduction Delay and Development of the Central CCS (B) The 48 hpf optical maps of calcium excitation represented by isochronal lines every 60 ms. Significant conduction delay was observed at the AV junction (arrowhead) and OFT (arrow). (C) Surface and (D) cross-sectional analyses of Tg(cmlc2:eGFP-ras)s883 hearts at 48 hpf reveal distinct cellular morphologies and orientations among atrial, ventricular, and AV (yellow boxes) cardiomyocytes. Schematic illustration of AV canal region to the right. OC and IC are outlined on projection of ventricle in (C). (E and F) Bar graphs represent cell morphology/circularity measurements of Tg(cmlc2:eGFP-ras)s883 hearts at 48 hpf: (E) surface of cardiomyocytes from the OC and IC of the ventricle as well as the AV myocardium and (F) atrial, ventricular, and AV canal cardiomyocytes on cross-sectional analysis. (G) Schematic representation of a 48 hpf heart. Individual cardiomyocytes are outlined in green. Endocardium is in blue. Numbers indicate temporal sequence of calcium activation in the heart. Yellow arrows indicate direction of cardiac conduction. Green circles indicate slow conduction pathway/pacemaker and AV conduction delay. Atr, atrium; Ven, ventricle; AVC, AV canal. EXPRESSION / LABELING:
|

Calcium Transients and APs Confirm That AV Myocardium Has Distinct Electrophysiologic Properties That Distinguish It from Atrium and Ventricle (B) Fluorescence intensity of a single pixel from each region was recorded to obtain calcium transients and plotted over time in seconds. All plots are semilogarithmic and identically scaled. (C) Average calcium transient for each cardiac region. (D) The APs from each of these regions were recorded in wild-type explanted 48 hpf hearts using patch pipettes and current clamp techniques. Distinct calcium transients and APs were detected in atrium, AV canal, and ventricle. |
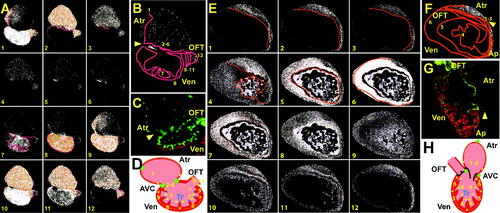
Development of the Fast Specialized Cardiac Conduction Tissue (A and E) Sequential calcium activation images of a 100 hpf (A) Tg(cmlc2:gCaMP)s878 heart and a 21 dpf (E) Tg(cmlc2:gCaMP)s878 ventricle during a single cycle in a live zebrafish. (B and F) The 100 hpf (B) and 21 dpf (F) optical maps of calcium excitation represented by isochronal lines every 60 ms. Ventricular calcium activation initiates along trabeculae at 100 hpf and 21 dpf and breaks through the rest of the myocardium propagating from OC to base at 100 hpf and apex to base at 21 dpf. (C and G) Confocal images of the heart at 100 hpf and 21 dpf. (C) The 100 hpf Tg(flk1:EGFP)s843 (green) larvae stained with rhodamine phalloidin (red) reveal that the hearts have completed cardiac looping and that the ventricles have formed trabeculae.(G) At 21 dpf, the ventricle forms a distinct apex. (D and H) Schematic representation of the hearts shown in (C) and (G). Numbers indicate temporal sequence of calcium activation in the heart. Yellow arrows indicate direction of cardiac conduction. Green circles indicate slow conduction nodes, and blue circles indicate fast conduction pathway. Atr, atrium; Ven, ventricle; AVC, AV canal; Tr, trabeculae. EXPRESSION / LABELING:
PHENOTYPE:
|
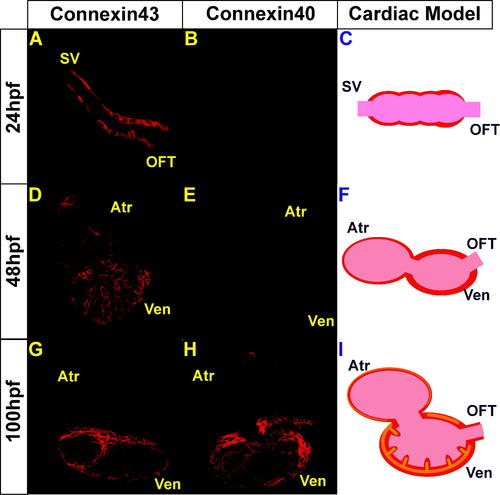
Immunolocalization of Cx40 and Cx43 in Wild-Type Hearts (A, D, and G) Cx43 immunoreactivity was observed throughout the myocardium at 24, 48, and 100 hpf while (B, E and H) Cx40 immunoreactivity was observed weakly at 48 hpf and strongly at 100 hpf. (C, F and I) Schematic representation of Connexin staining at each developmental stage. Cx43 immunoreactivity is observed throughout the myocardium at all stages and represented in red, and Cx40 immunoreactivity is observed at later cardiac developmental stages and represented in orange. |

Hemodynamic Flow Is Required for the Development of the Fast CCS (C) Confocal images of sih mutant hearts at 100 hpf. Tg(flk1:EGFP)s843; sih mutant embryos were stained with rhodamine phalloidin (red). The heart has completed cardiac looping; however, the ventricle has failed to form trabeculae. (D) Schematic representation of the heart shown in (C). Yellow and orange numbers indicate sequential calcium activation in sih mutant hearts from (A and B), respectively. Yellow arrows indicate direction of cardiac conduction. Green circles indicate slow conduction nodes. Note the immature lateral conduction as well as heart block across ventricular myocardium (B and B′). (E and F) Immunolocalization of Cx40 and Cx43 in sih mutant hearts. Cx40 immunoreactivity was not observed in mutant hearts at 100 hpf. Atr, atrium; Ven, ventricle; AVC, AV canal. |

Optical Maps of Cardiac Conduction Mutants (A) Ventricular conduction is absent in 48 hpf siv mutant hearts. (B) Disorganized ventricular conduction was observed in 48 hpf dcc mutant hearts. (C) AV conduction block is present in 48 hpf hob mutant hearts. (D) AV conduction delay is absent in 48 hpf sli mutant hearts. (E) Organized ventricular conduction is absent in 96 hpf ddl mutant hearts. (F) AV conduction delay is present in 48 hpf sih mutant hearts. Atr, atrium; AV, AV canal; Ven, ventricle. |
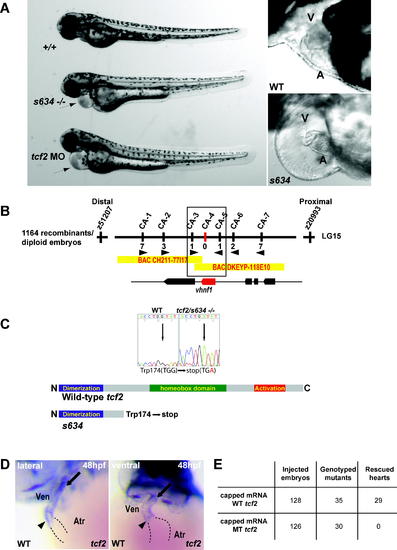
s634 Affects tcf2 (B) Genetic map of the s634 region. Numbers below simple sequence length polymorphism markers indicate recombination events. Two genes were identified within the critical region, which spans two bacterial artificial chromosomes. (C) Sequencing of tcf2s634 cDNA revealed a G to A change at base pair 522, resulting in a premature stop codon at amino acid 174 thereby removing the homeobox and transactivation domains. (D) Whole mount RNA in situ hybridization at 48 hpf reveals tcf2 expression at the AV canal (arrowhead) and the OFT (arrow) region of the ventricle. (E) Injection of wild-type tcf2 mRNA rescued the heart phenotype of ∼82% of s634 mutants, while injection of mutant tcf2 mRNA failed to rescue. A, atrium; V, ventricle. |
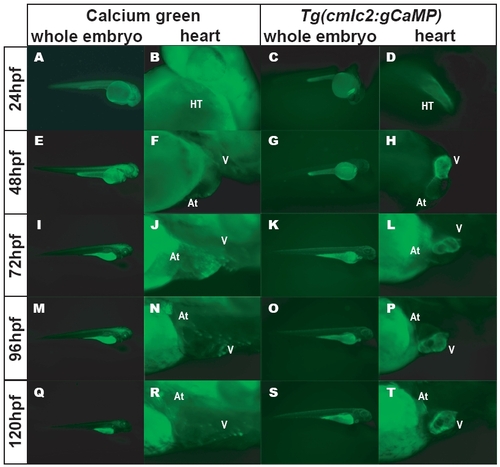
Comparison of Calcium-Green–Injected Embryos versus Stable Tg(cmlc2:gCaMP)s878 Embryos (B, F, J, N, R) Higher magnification epifluorescence micrographs of calcium-green-injected embryos focusing on the hearts at 24, 48, 72, 96, and 120 hpf. Weaker calcium-green fluorescence is observed as the embryos develop. (C, G, K, O, S) Epifluorescence micrographs of Tg(cmlc2:gCaMP)s878 live embryos at 24, 48, 72, 96, and 120 hpf. Specific gCaMP fluorescence is detected only in hearts. Autofluorescence is detected in the yolk. (D, H, L, P, T) Higher magnification epifluorescence micrographs of Tg(cmlc2:gCaMP)s878 embryos focusing on the hearts at 24, 48, 72, 96, and 120 hpf. Autofluorescence from yolk does not interfere with imaging the hearts. |

ZFIN is incorporating published figure images and captions as part of an ongoing project. Figures from some publications have not yet been curated, or are not available for display because of copyright restrictions. |