
- Title
-
Protocadherin-18a has a role in cell adhesion, behavior and migration in zebrafish development
- Authors
- Aamar, E., and Dawid, I.B.
- Source
- Full text @ Dev. Biol.

Pcdh18 family homology, predicted structure and localization. (A) The closest relative to the protein we describe, Pcdh18a (ABX64360), is the protein described by (Kubota et al., 2008), labeled Pcdh18k (BAF96395). Both are related to Pcdh18 in Mus musculus (m, AAL47095, 65%), Homo sapiens (h, AAH93815, 66%), Xenopus tropicalis (xt, NP_001011150, 66%) and Rattus norvegicus (r, XP_227117, 65%). (B) Predicted protein structure of zebrafish Pcdh18a. SP, signal peptide sequence (1–29aa); CA1–CA6, six cadherin repeats in the extracellular region (30–701aa); TM, transmembrane region (702–724aa); the cytoplasmic tail (725–1123aa) contains two conserved motifs, CM1 (858–888aa) and CM2 (909–926aa), an SH3 binding motif (755–758aa) and a Disabled-1 binding motif (1044–1047aa). Below is shown the exon/intron arrangement of zfpcdh18a, containing four exons as is typical of pcdhs. (C) Confocal image of a zebrafish embryo at 80% epiboly injected at the one-cell stage with membrane-bound red fluorescent protein (mRFP, red) and pcdh18a-eGFP fusion construct (green). The fusion protein is expressed in a punctate manner at the membranes between cells. The scale is 10 μm. |

Pcdh18a expression in zebrafish embryos. (A) RT-PCR reactions for pcdh18a and histone 4 (H4) as control were performed for different stages (1–8: unfertilized eggs, 100–200 cells, high dome, 40–50% epiboly, 80–90%, bud, 6 somites, and 24 h embryos, respectively). Pcdh18a is expressed zygotically but not maternally. (B–O) In situ hybridization for pcdh18a. (B) Pcdh18a is expressed in the epiblast at about 60% epiboly (lateral view). (C–E) Dorsal views of shield (C), 60% (D) and 90% (E) epiboly stages. (F, G) Anterior views and (H) lateral view of bud (F) and 1 somite stage (G, H), showing lateral expression in addition to the midline expression that arose earlier. (I–L) Lateral views of 2 somite (I), 6 somite (J), 13–14 somite (K), and 18 somite (L) stages. Expression is detected in midbrain, diencephalon, telencephalon, thalamus, hindbrain, spinal cord, otic vesicles and branchial arches. (M) 24hpf embryo; inset, higher magnification of the tail showing expression in spinal cord but not notochord, hypochord or floor plate. (N) 2-day and (O) 3-day old embryos, showing reduced expression that becomes restricted to the branchial arches. B, branchial; hb, Hindbrain; sc, spinal cord; th, thalamus; tm, tectum; d, diencephalon; t, telencephalon; ov, otic vesicles; nt, notochord; hy, hypochord; fp, floor plate. EXPRESSION / LABELING:
|
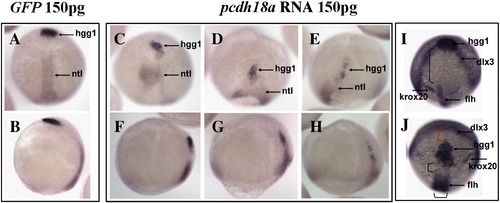
Pcdh18a overexpression affects cell movements. Embryos injected with pcdh18a RNA showed delayed epiboly and impaired cell movements. (A–H) In situ hybridization with ntl plus hgg1 in embryos injected with 150 pg GFP RNA (A, B), or 150 pg pcdh18a RNA (C–H, three examples shown). In one of several similar experiments, as 95% (n = 37) of control embryos reached 95% epiboly, the pcdh18a-injected embryos were at about 80% epiboly, had shorter and wider ntl domains, and hgg1-positive cells did not advance normally (60% of embryos, n = 57). (A, C–E) are dorsal views, (B, F–H) are lateral views. (I, J) Anterior views with dorsal to bottom, showing in situ hybridization using probes for hgg1, flh, krox20 and dlx3 for GFP (I), or pcdh18a RNA-injected embryos (J); control embryos were at bud stage. The anterior migration of hgg1-positive cells is delayed, leading to a gap (red parenthesis in panel J) between the hgg1 and dlx3 domains, while the distance from the hgg1 domain to the krox20 and flh domains is reduced (black parenthesis). |

Hatching gland mislocalization in Pcdh18a-overexpressing embryos. In situ hybridization with hgg1 on 12-somite stage embryos (A–J) injected with 100 pg GFP RNA (A, B) or 100 pg pcdh18a RNA (C–J). In two experiments, 13 of 24 (54%) of the pcdh18a RNA-injected embryos showed mislocalization of hgg1, while none of the GFP-injected embryos (n = 18) did. (I, J) show two examples of hgg1 staining (asterisk) in relation to the neural tube (NT), taken at higher magnification in anterior view. (K–P) In situ hybridization with hgg1 (asterisk), krox20 (arrow) and eng2 (arrowhead) at 24hpf, shows mislocalization of hgg1-expressing cells, but an almost normal pattern of krox20 and eng2 in embryos injected with 100 pg pcdh18a RNA (37 of 50, 74%, in three experiments; M–P). None of the 34 GFP RNA-injected embryos showed this phenotype (K, L). (Q–X) Neural tube duplications in pcdh18a RNA-injected embryos at 28hpf were visualized by in situ hybridization with pax2.1 (S, T), and wnt1 (W, X); control embryos are shown in panels Q, R, U, V. Combining data from several experiments using different markers showed duplications in 119 of 202 (59%) injected embryos. |
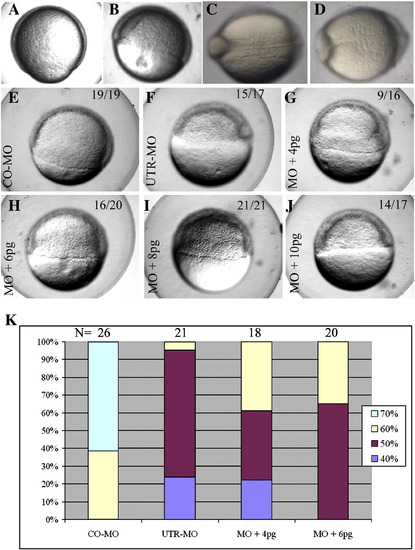
Impaired development resulting from pcdh18a knockdown, and rescue by pcdh18a RNA co-injection. CO-MO (A, C) or pcdh18a ATG-MO (5 ng) (B, D) were injected into embryos at the one-cell stage. ATG-MO-injected embryos (B) showed delayed epiboly (11 of 17, 74%, in one of five experiments) compared to controls (A). Likewise, as control MO-injected embryos reached the 5 somite stage (C), ATG-MO-injected embryos contained 3–4 somites that were wider than normal (D; 25 of 32, 78%). (E–J) Phenotype caused by UTR-MO and its rescue. UTR-MO (F–J) was injected alone (F) or together with 4, 6, 8, and 10 pg pcdh18a RNA (G–J, respectively); CO-MO is in panel E. The UTR-MO-injected embryos showed a delay in epiboly that was rescued by co-injection of the RNA. Quantification of one of four similar experiments is shown in panel K. The color code refers to the percentage of embryos in the respective stage of epiboly at the same time point. PHENOTYPE:
|
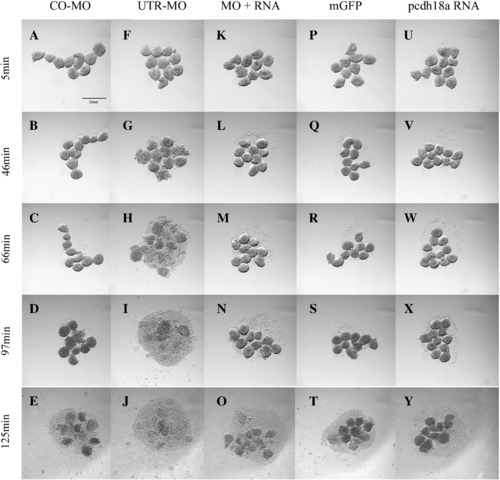
Pcdh18a affects cell dissociation. Embryos injected with 10 ng CO-MO (A–E), 8 ng pcdh18a 5′ UTR-MO (F–J), 250 pg mGFP RNA (P–T), 250 pg pcdh18a RNA (U–Y), and a combination of 8 ng UTR-MO and 250 pg pcdh18a RNA (K–O), were tested for cell dissociation. Blastoderms were dissociated in CMFM with rotation (see Materials and methods), and photographed at the times indicated. The test was repeated three times with consistent results. Scale bar shown in panel A is 1 mm. PHENOTYPE:
|

Pcdh18a affects cell sorting. Red and green labeled cells were mixed and allowed to aggregate (see Materials and methods). Control cells aggregated uniformly (A–C, G, H, K). When red cells injected with pcdh18a 5′ UTR-MO were mixed with green cells injected with pcdh18a RNA, aggregates were less uniform with green cells tending to cluster (D–F, I, J, M). To make a quantitative presentation of the effect, we traced the areas occupied by red and green cells in the same aggregate for each of 30 control or experimental aggregates (illustrated in G–J; K, M are merged images), using the “Northern Eclipse” program from Empix Imaging, Inc. (http://empix.com/). The ratios are displayed using the online program (http://www.physics.csbsju.edu/stats/t-test.html) and Microsoft office Excel (L). Panel L shows the control ratios on line A (0.93 ± 0.11) and experimental ratios on line B (0.42 ± 0.15); the difference is highly significant (1.00E- 21 by the two tailed t-test). Scale bar is 100 μm as shown for panels A–F in panel A, and for panels G–J, K, M in panel G. |

Cell migration, behavior and shape are affected by Pcdh18a overexpression. Cells from embryos injected with 150–200 pg GFP RNA and 2.5 ng fluoro-emerald dextran (green cells), or 150–200 pg pcdh18a RNA and 5 ng fluoro-ruby dextran (red cells), were transplanted to the same region in the margin of uninjected host embryos at 40% epiboly (A–D), and cultured to 80–90% epiboly (E–H). Host embryos were examined in visible light (A, E) and by fluorescence microscopy (C, D, F, G; overlays in panels D, H). In 43% of the embryos examined, the green control cells migrated farther than the red Pcdh18a-expressing cells. (I) A different transplanted embryo was examined by confocal microscopy, showing the same effect at higher magnification (scale bar, 50 μm). (J–L) Confocal micrographs of cells from embryos injected with emerald dextran together with 150 pg of GFP RNA (J, K), or pcdh18a RNA (L), transplanted into separate host embryos. Cell protrusions are visible in control cells but are missing in the pcdh18a-expressing cells. Scale bar is 20 μm. Cells shown in panel J are from an embryo fixed and mounted in glycerol, while the cells shown in panels K and L are from live embryos mounted in low melt agarose. (M, N) 20 pg mGFP alone or 10 pg mGFP in combination with 10 pg pcdh18a RNAs was injected into one cell at the 64-cell stage. Confocal microscopy at 70% epiboly showed fewer protrusions in pcdh18a RNA-injected embryos compared to controls (M, N). Scale bar in panels M and N is 10 μm. |
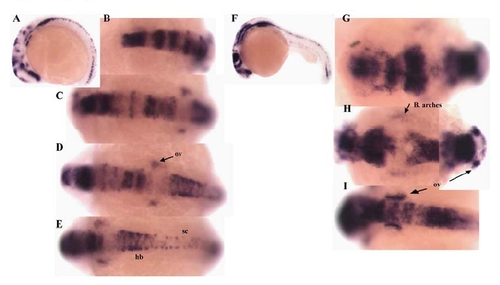
Lateral (A, F) and dorsal views taken from different angles (C-E, G-I, anterior to left) of two embryos, after in situ hybridization with pcdh18a; (A-E) 13-14 somites, (F-I) 24hpf. hb, hindbrain; sc, spinal cord; ov, otic vesicles. EXPRESSION / LABELING:
|

Overexpression of Pcdh18a in zebrafish embryos results in a range of phenotypes. Twelve-somite stage control embryos injected with 100pg GFP RNA (AD). Embryos injected with 100pg pcdh18a RNA, at 12 somites (E-H), and 24hpf (I-L) stages. Phenotypes include shortened axis (double arrows in E), cyclopia (K,L), and single eye on one side (J). Dorsal views, except lateral views (A,E). |
Reprinted from Developmental Biology, 318(2), Aamar, E., and Dawid, I.B., Protocadherin-18a has a role in cell adhesion, behavior and migration in zebrafish development, 335-346, Copyright (2008) with permission from Elsevier. Full text @ Dev. Biol.