
- Title
-
ERK1 and ERK2 MAPK are key regulators of distinct gene sets in zebrafish embryogenesis
- Authors
- Krens, S.F., Corredor-Adamez, M., He, S., Snaar-Jagalska, B.E., and Spaink, H.P.
- Source
- Full text @ BMC Genomics
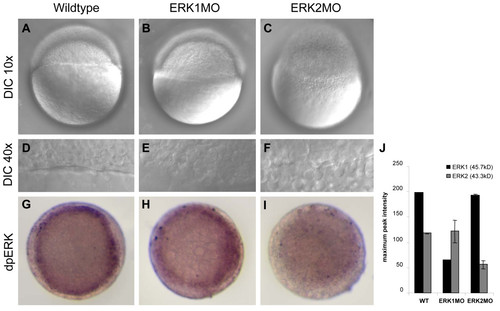
Phenotype and Function analysis of morpholino mediated knockdown of ERK1 and ERK2. Differential interference contrast (DIC) microscopy of 4.5 h old embryos using a 10x objective (A,B,C,) or an enlargement of the margin, using a 40x objective (D,E,F) Wild type (Wt) and ERK1 morphants are at approximately 30% epiboly stage and undergo epiboly, whereas ERK2 morphants do not initiate epiboly. Localization of active ERK (dpERK) was detected by immuno-localization in wild type, ERK1MO and ERK2MO injected embryos at 4.5 hpf (G-I) by phospho-specific ERK antibody. The level of dpERK was lower in ERK1 morphants compared to wild type embryos, whereas ERK2 morphants hardly showed any active ERK staining, (A-C); lateral view, animal pole to top, (G-I); animal pole view, dorsal to right. The bar graphs in (J) represent the quantification of a western blot analysis of zebrafish wild type, ERK1MO and ERK2MO injected embryos, probes with a global ERK1 antibody (Santacruz). This antibody recognizes both zebrafish ERK1 (45.7 kD) and ERK2 (43.3 kD) protein. The bars represent the maximum pixel-intensity measured in duplo and clearly show the specific knockdown of either ERK1 or ERK2 by the corresponding morpholino. EXPRESSION / LABELING:
PHENOTYPE:
|

Quantitative real-time PCR confirmation of the microarray results. (A-G) qPCR was performed on seven genes that showed differential regulation of expression in response to knockdown of either ERK1, ERK2 and the standard control MO control:cdh2 (NM_131081), mycn (NM_212614), erm (NM_131205), cfos (NM_205569), mos (NM_205580), snai1a (NM_131066) and vegf (NM_131408), correlated to the β-actin housekeeping gene. A comparison of the fold changes in expression of these genes, detected by qPRC assay and microarray, are listed in a table (H). ⇑ = induction of expression, ⇓ = repression of expression, compared to the standard control MO (A-C, red line). EXPRESSION / LABELING:
|

Effects of ERK1 and ERK2 knockdown affect developmental signaling pathways confirmed by whole mount in situ hybridization. The zebrafish embryos were injected with 3.4 ng ERK1MO (B,E,H,K,N,Q) or ERK2MO (C,F,I,L,O,R) and in situ expression patterns, were compared to wild type embryos (A,D,G,J,M,P). The embryos were fixed at 4.5hpf, processed for whole mount in situ hybridization, and imaged (animal pole view, dorsal to right). A,B,C: goosecoid (gsc, presumptive shield/dorsal organizer); D,E,F: lft1/antivin, (blastula margin); G,H,I: vox (expressed in blastula, but the dorsal most region); J,H,L vent (ventral blastula margin); M,N,O, notail (ntl, blastula margin); P,Q,R,: tbx6 (margin). EXPRESSION / LABELING:
|

ERK1 knockdown phenotype at 24 and 48hpf. Images show representative examples of surviving ERK1 morpholino injected embryos with a tailless phenotype at 24 and 48hpf. |