
- Title
-
The Mych Gene Is Required for Neural Crest Survival during Zebrafish Development
- Authors
- Hong, S.K., Tsang, M., and Dawid, I.B.
- Source
- Full text @ PLoS One

Characterization of mych and comparison of vertebrates Myc proteins. |

Detection of mych transcripts by in situ hybridization. EXPRESSION / LABELING:
|
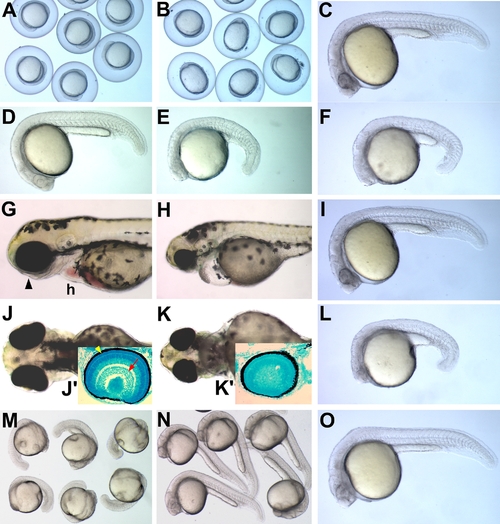
Mych morphant phenotypes. PHENOTYPE:
|

Mych MO affects multiple regions at the 3-somite stage. EXPRESSION / LABELING:
PHENOTYPE:
|

Reduced expression of early anterior brain markers after mych MO injection. EXPRESSION / LABELING:
PHENOTYPE:
|
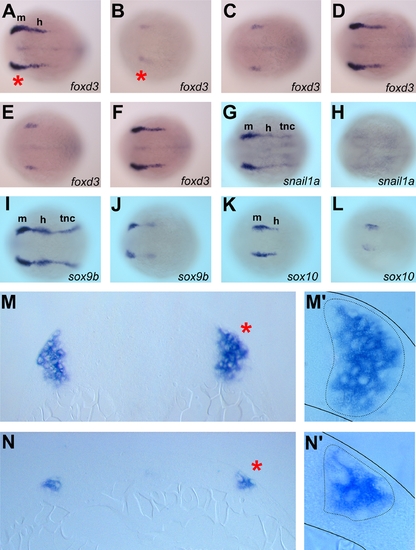
mych MO impairs early neural crest induction. EXPRESSION / LABELING:
PHENOTYPE:
|

Multiple defects in pharyngeal arch development caused by mych MO. |

Mych depletion results in apoptosis in the early neural plate. PHENOTYPE:
|
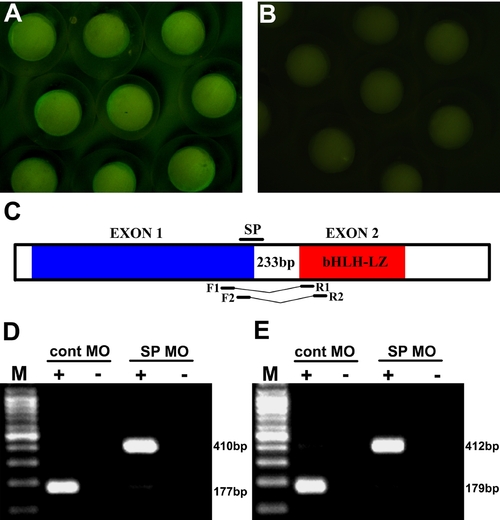
Mych MO specificity. A–B. Mych:GFP signal detection at the bud stage after injection with (B) or without (A) mych UTR MO. C. Schematic drawing of mych SP MO design and two different sets of RT-PCR primers. D–E. RT-PCR shows that the SP MO eliminates the normal mature mRNA band. Embryos were collected at the 3-somite stage. |

Unillustrated author statements EXPRESSION / LABELING:
PHENOTYPE:
|