
- Title
-
CD41+ cmyb+ precursors colonize the zebrafish pronephros by a novel migration route to initiate adult hematopoiesis
- Authors
- Bertrand, J.Y., Kim, A.D., Teng, S., and Traver, D.
- Source
- Full text @ Development
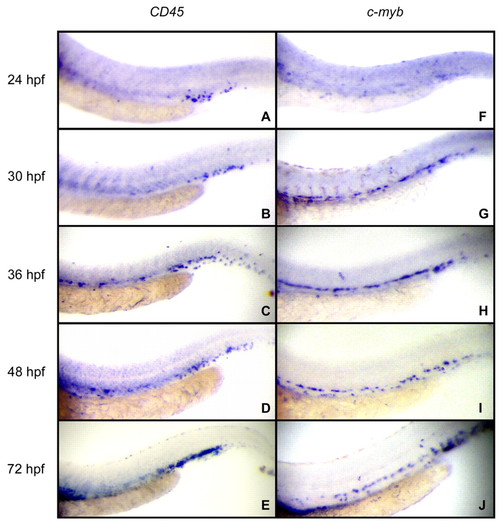
Expression of CD45 and cmyb marks regions of definitive hematopoiesis in the zebrafish embryo. (A-E) CD45 expression initiates in the PBI by 24 hpf. (B) By 30 hpf, occasional cells begin to appear between the axial vessels in the AGM (ventral to the yolk tube extension). (C-E) Robust expression is observed in both the PBI/CHT and AGM regions from 36 hpf onwards. (F-J) cmyb expression marks cells within the AGM slightly before CD45 is expressed. (H-J) After 36 hpf, cmyb expression is observed in a similar pattern to CD45 throughout the AGM and CHT. All animals are displayed anterior towards the left and dorsal side upwards. EXPRESSION / LABELING:
|

A CD41:eGFP transgene marks cells in the AGM, along the pronephric ducts and in the thymic lobes. (A) Overview of regions shown at higher magnification in fluorescent images. Purple region denotes left thymic lobe, blue region the left pronephric tubule and red region the AGM (space between axial vessels). (B-E) CD41 is expressed in the first thymic immigrants at ∼48 hpf. GFP+ cells increase in number until 78 hpf, after which GFP expression disappears. (F-I) GFP+ cells appear along the pronephric tubules beginning at ∼32 hpf, and increase in number over time. Broken lines indicate the boundaries of the duct. (J-N) GFP+ cells are first observed in the AGM region at ∼27 hpf, and increase in number over time. After 48 hpf, the AGM region greatly expands as the aorta and vein move apart. The upper broken line denotes the ventral wall of the dorsal aorta, the lower line the dorsal wall of the cardinal vein. GFP+ ductal cells appear ventrolateral to cells within the demarcated AGM region. Images are Nomarski/fluorescence merges. Embryos positioned anterior towards the left and dorsal side upwards. |
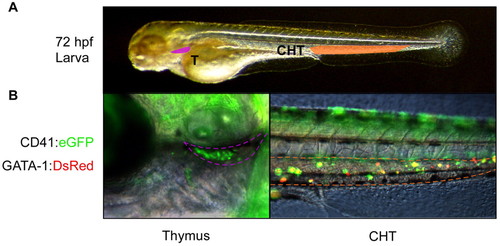
Transplanted CD41:eGFP+ cells colonize the thymus and caudal hematopoietic tissues. (A) Photograph indicating regions shown at higher magnification in B (Nomarski/fluorescence merge). Purple region denotes left thymic lobe and orange region the CHT. (B) One day after transplantation, recipient animals showed robust colonization of thymi (left panel) and the CHT (right panel). Transplanted CD41+ cells also carried a gata1:DsRed transgene to visualize erythroid differentiation. |

AGM CD41:eGFP+ cells seed the thymus to become rag2+ thymocytes. (A) Upper left panel shows one CD41:eGFP+ cell immediately after rhodamine uncaging at 40 hpf (arrowhead). Ten cells were uncaged per embryo, and thymic lobes (areas within broken lines in lower panels) were analyzed at 4 dpf. Rhodamine+ cells were observed in the thymic lobes, along with GFP+ cells that were not uncaged (lower left panel). Control animals where regions outside of the AGM were laser uncaged never showed rhodamine+ thymic cells (right panels). (B-D) Similar uncaging experiments using CD41:eGFP, Rag-2:eGFP double transgenic animals show labeled thymic immigrants are lymphoid. (B) CD41:eGFP+ cells were laser targeted at 40 hpf in the AGM and thymi analyzed at 5 dpf, when thymic cells no longer express the CD41 transgene (left panel; asterisks mark circulating CD41+ thrombocytes) and when nascent thymocytes robustly express the rag2 transgene (right panel). (C) Targeted CD41:eGFP+ cells migrate to the thymus and express the rag2 transgene. Left panel shows GFP expression in a representative thymic lobe, middle panel clones of rhodamine+ cells and right panel a merged imaged, including Nomarski overlay. (D) Confocal imaging of targeted thymic immigrants. Left panel shows a maximum projection of the entire thymic lobe, and shows a rhodamine+ GFP- cell migrating (arrowhead) into the thymus via a posterior thymic duct (arrow). Right panel shows a single z-slice through the thymus showing expression of GFP and rhodamine. All embryos oriented dorsal side upwards, anterior towards the left. |
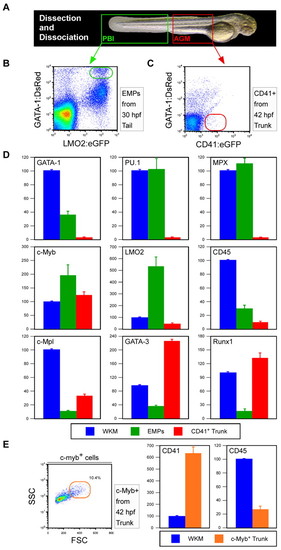
Comparison of gene expression profiles between purified AGM cells and EMPs. (A) PBI (green box) or AGM (red box) regions were dissected from embryos at 30 or 42 hpf, respectively. (B) EMPs were purified from PBI preparations by flow cytometry based on co-expression of gata1:DsRed and lmo2:eGFP transgenes (green gate). (C) Presumptive HSCs were purified from AGM preparations by flow cytometry based on CD41:eGFP+ gata1:DsRed- expression (red gate). (D) QPCR was performed for a variety of lineage-affiliated genes. Whole-kidney marrow (WKM; blue bars) was used as the reference standard for all analyses of EMP (green bars) and CD41+ trunk cell expression (red bars). (E) cmyb+ FSChi trunk cells (orange gate) were purified from dissected trunks of 42 hpf cmyb:eGFP embryos for QPCR analyses (orange bars). |
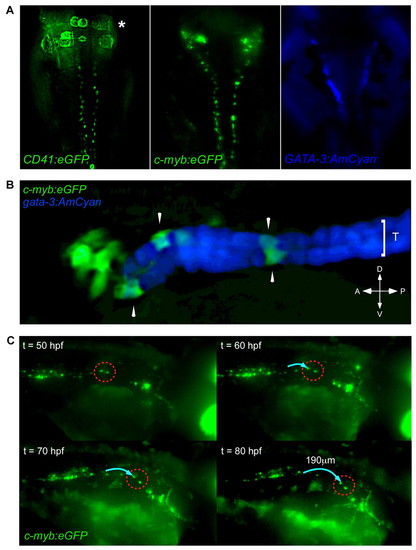
Hematopoietic precursors migrate along the pronephric tubules. (A) CD41:eGFP (left panel; asterisk marks fluorescence from circulating thrombocytes) and cmyb:eGFP (middle panel) transgenes are expressed in cells along each pronephric tubule. The anterior pronephric tubules are marked by a gata3:AmCyan transgene (right panel). Dorsal views of animals with anterior side upwards. (B) cmyb:eGFP+ cells (arrowheads) are localized upon gata-3:AmCyan+ pronephric tubules (T). (C) Timelapse imaging demonstrates cmyb:eGFP+ cells migrate along the pronephric tubules in an anterior direction. Two GFP+ cells (dotted red circle) were observed to migrate ∼190 μm (blue arrow) over 30 hours. Embryos imaged dorsal side upwards, anterior towards the right. EXPRESSION / LABELING:
|
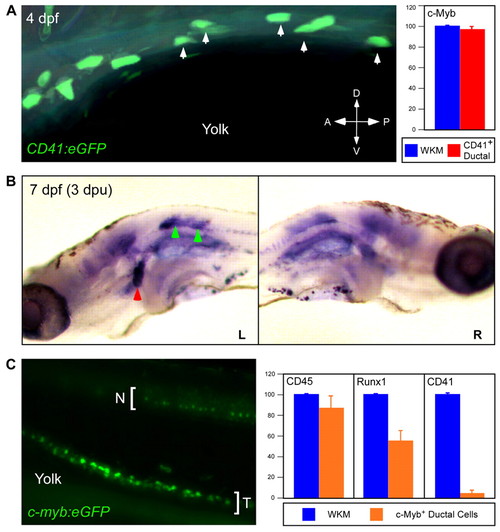
Characterization of hematopoietic precursors on the pronephric tubules. (A) FITC was uncaged in 5 CD41:eGFP+ cells (arrows) at 4 dpf along the left pronephric tubule. CD41:eGFP+ cells express cmyb (right panel). (B) Animals were fixed 3 days post-uncaging and analyzed for uncaged FITC. Ductal cells migrated from targeted region on the left pronephric tubule (green arrowheads, left panel) to the left anterior pronephros (red arrowhead). Contralateral anterior pronephri were not colonized (right panel). (C) cmyb:eGFP+ tubular cells (T) were purified away from GFP+ neural cells (N) from 75 hpf dissected trunks by flow cytometry and analyzed for hematopoietic gene expression (right panel). EXPRESSION / LABELING:
|

A cmyb:eGFP transgene marks cells in the AGM, along the pronephric ducts and in the thymic lobes. (A) Overview of regions shown in high-magnification fluorescent images. Purple region denotes left thymic lobe, blue region the left pronephric duct and red region the AGM (space between axial vessels). (B-E) cmyb is expressed in the first thymic immigrants beginning at ∼48 hpf. (F-I) GFP+ cells appear along the pronephric tubules beginning at ∼32 hpf, and increase in number over time. Broken lines indicate the boundaries of the duct. (J-N) Within the embryo, GFP+ cells are first observed in the AGM region at ∼27 hpf. After 48 hpf, the AGM region greatly expands as the aorta and vein move apart. The upper broken line indicates the ventral wall of the dorsal aorta, the lower line indicates the dorsal wall of the cardinal vein. GFP+ ductal cells appear ventrolateral to cells within the demarcated AGM region. Images are merged fluorescence and Nomarski photographs. Embryos are positioned anterior towards the left and dorsal side upwards. |
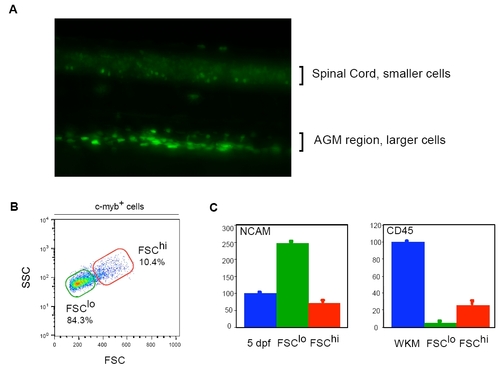
HSCs and neurons can be segregated by light scatter characteristics from cmyb:eGFP embryos. (A) Lateral view of a cmyb:eGFP embryo at 42 hpf. The spinal cord shows small round GFP+ cells, whereas larger and brighter cells are observed in the AGM region (dorsal side upwards, anterior towards the left). (B) cmyb:EGFP+ cells were analyzed by forward (FSC) and side (SSC) scatter characteristics. Cells were sorted by size (red gate, larger; green gate, smaller). (C) QPCR analysis shows that FSClo cells are highly enriched for NCAM-expressing cells, whereas FSChi cells are enriched for CD45-expressing cells. EXPRESSION / LABELING:
|

A CD45:DsRed transgene marks a subset of AGM HSCs and differentiated leukocytes. (A) Deconvolved image stacks through the 76 hpf AGM shows a subset of CD45:DsRed+ cells (upper left panel) also express the CD41:eGFP transgene (upper left panel). Lower panels show merged channels, with Nomarski overlay on the right. Arrowheads mark double positive cells, brackets mark the boundaries of the dorsal aorta (DA) and cardinal vein (CV). (B) Double transgenic animals show GFP+ cells along the pronephric ducts and DsRed+ cells within the anterior pronephros. All animals oriented dorsal side upwards, anterior towards the left. OV, otic vesicle. |
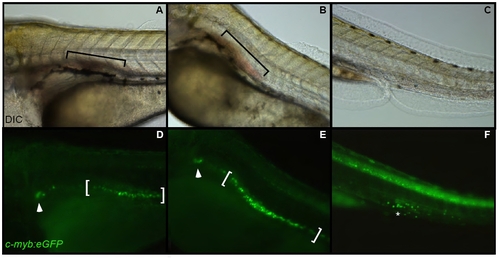
Circulation is not required for translocation of hematopoietic precursors to the pronephric tubules or anterior pronephros. (A,B) silent heart morphants did not develop circulation, as shown by erythrocyte pooling (black brackets). (D,E) cmyb:eGFP+ cells translocated normally to the pronephric tubules (majority of ductal cells flanked by white brackets), and migrated to the anterior pronephri (arrowheads). (C,F) cmyb:eGFP+ cells (asterisk) only rarely appeared (3/18 morphants) within the CHT. All animals photographed at 72 hpf with dorsal side upwards, anterior towards the left. PHENOTYPE:
|