
- Title
-
Histone deacetylase 3 (hdac3) is specifically required for liver development in zebrafish
- Authors
- Farooq, M., Sulochana, K.N., Pan, X., To, J., Sheng, D., Gong, Z., and Ge, R.
- Source
- Full text @ Dev. Biol.

HDACs are required for liver and exocrine but not endocrine pancreas formation. (a) Embryos from Tg(lfabp:RFP; elaA:EGFP) and Tg(fli-1:EGFP) were treated from shield stage with VPA (20 μM) as described in Materials and methods. Liver formation was examined by the appearance of red fluoresce (white arrows) at 3 dpf (A), 4 dpf (C) and 5 dpf (E and F). In VPA-treated embryos, liver was not formed up to 4 dpf as judged by the absence of red fluorescent, while a much smaller liver emerged at 5 dpf (E and F). Blood vessel was monitored by green fluorescence and ISV defect is indicated by thin white arrow (G, H). (b) Liver formation analyzed by liver differentiation marker Ceruloplasmin (cp) expression at various stages of liver formation including 32 hpf (A, B) and 48 hpf (C, D), 3 dpf (E, F), 4 dpf (G, H) and 5 dpf (I, J). Cp expression was absent in liver (white arrow) in VPA-treated embryos up to 3 dpf although its expression in YSL (white arrowhead) was not affected (C, D, E and F). A small number of liver cells start to express Cp at 4 dpf which grew, but never reached the control liver size at 5 dpf (I vs. J). All the images are dorsal views, anterior to the left. (c) Liver and exocrine pancreas formation analyzed in transgenic line and endocrine pancreas formation analyzed by insulin expression. Panels A–D are merged images of z-stack taken by confocal microscope. Liver (in red) is indicated by a thick white arrow and exocrine pancreas (in green) by a thin white arrow. Endocrine pancreas (black arrow, E–J) as indicated by insulin (ins) expression was not affected by VPA treatment from 2 dpf to 5 dpf. All the images are dorsal views, anterior to the left. Scale bar represents 100 μm for all panels except in panel aG, which represent 30 μm and panel cA, which represents 50 μm. |

The liver defects in VPA-treated embryos correlated with inhibition in HDAC enzymatic activity. (a) HDAC enzymatic activity in zebrafish embryos were measured by fluorescent based assay. Embryos were treated (from 15-somite stage) with VPA (20 μM) and harvested at different stages. Total HDAC enzymatic activity was inhibited from 1 dpf onward and maximum reduction (around 75%) was observed at 2–3 dpf in VPA-treated embryos. (b) Embryos from Tg(lfabp:RFP; elaA:EGFP) were treated with TSA (B, D, G), a structurally unrelated HDAC inhibitor, and Valpromide (VPM) (C, E, H), a structural analogue of VPA which does not inhibit HDAC. Liver formation was observed at 3 dpf (A–C), 4 dpf (D–E) and 5 dpf (F–H). No liver was observed in TSA-treated embryos up to 4 dpf (B, D) while a small liver appeared at 5dpf (G, white arrow). Liver formation was unaffected in VPM-treated embryos (C–H, white arrows). All the images are lateral view, anterior to the left. Scale bar is 50 μm. EXPRESSION / LABELING:
|

Liver formation in zebrafish does not require vascularization. Zebrafish embryos from triple transgenic line were treated with VPA (20 μM). Severe defects in intersomatic blood vessels (ISV) (thin white arrows) and subintestinal blood vessels (SIV) (wide white arrow) were observed up to 5 dpf (E–H). Liver only appeared on 5 dpf and no or minimum liver vascularization was observed (H). Similar angiogenesis defects were observed in embryos treated with angiogenesis inhibitors SU5614 (5 μM, I–L) and SU1498 (5 μM, M–P). However, liver (thick white arrows) formed normally on 3 dpf and grew extensively from 3 dpf to 5dpf in these embryos (I–P). All images are lateral view, anterior toward left. The images D, H, L and P are confocal images of merged z-stacks. The scale bar is 100 μm in panel A, and 30 μm in panel D. EXPRESSION / LABELING:
|

HDACs are required for early liver development. Expressions of early liver markers were analyzed by WISH in WT and VPA-treated embryos including hhex (A–D, K, L), prox1 (E–H, M, N) and foxa3 (I, J, O, P). All panels are whole mount pictures except panels B, D, F and H which are tissue sections corresponding to panels A, C, E and G, respectively, with section planes indicated by red lines. In all panels, liver is indicated by a thick white arrow while pancreas is indicated by a thick black arrow. Expression of hhex was completely abolished in liver and pancreatic islet (C vs. A) at 24 hpf in VPA-treated embryos while its expression in intermediate cell mass (ICM) (A vs. C, thin black arrow) remains unaffected. Note that panels A and C were focused on different focal planes with panel A focusing on the liver region while panel C focusing on the more posterior ICM. White arrowhead indicates hhex expression in notochord (A–D) and black arrowhead in panels C and D refers to hhex expression in anterior endoderm. At 48 hpf, hhex expression in liver and pancreatic islet was significantly reduced (K vs. L). prox1 expression in liver region was absent in treated embryos at 28–30 hpf (E vs. G, F vs. H) while its expression was greatly reduced at 48 hpf (M vs. N). The green arrowhead in panel E indicates interregnal gland which also expresses prox1 at this stage. Initial endoderm thickening at liver region was absent in treated embryos at 28–30 hpf as judged by foxa3 expression (I vs. J, white arrow). At 48 hpf, a slightly small and compressed liver was observed in VPA-treated embryos while the hepatic duct was still not well formed (O vs. P, thin green arrow). All imagines are dorsal view, anterior to the left. Scale bar represents 100 μm in panels A, C, E, G, I and J; 20 μm in panels B, D, F and H; 50 μm in panels K–P. Lv: liver; Pn: pancreas; in: intestine; Sb: swim bladder. |

Role of hdac1 in zebrafish liver, pancreas and blood vessels development. (a) Liver development in hdac1 morphants (6 ng/embryo MO) was analyzed in Tg(lfabp:RFP; elaA:EGFP) from 3 dpf to 5 dpf. Control embryos were injected with the same amount of hdac1 5 bp mismatch MO. Liver (thick white arrow) formed relatively normal in hdac1 morphants at 3 dpf (A, B). However, its subsequent growth was reduced compared to control embryos (E–H). Angiogenesis was analyzed in Tg(fli-1:EGFP) at 3 dpf. SIVs were absent (thin white arrow, D) while ISV defects were mild and rare (thin red arrow, C and D). hdac1 morphants exhibited global embryonic defects with severe cardiac edema, small head and eyes as well as absence of craniofacial cartilage structures (B–H). Scale bar is 100 μm. (b) Zebrafish pancreas development in hdac1 morphants was analyzed by elastase B (A, B) and insulin (C–H) expression through WISH in hdac1 morphants with 5 bp mismatch MO injected embryos as control (Con.). Exocrine pancreas (white arrow) was significantly reduced at 5 dpf (A, B) but endocrine pancreas formation (black arrow) was not affected (C–H). All images are dorsal views, anterior to the left. Scale bar is 100 μm. EXPRESSION / LABELING:
PHENOTYPE:
|

hdac3 is specifically required for liver formation in zebrafish. (a) hdac3 was knocked down by antisense morpholino (12 ng/embryo) in Tg(lfabp:RFP; elaA:EGFP) and liver formation was observed from 3 dpf to 5 dpf. Control (Con.) embryos were injected with 5 bp mismatch antisense morpholino. Blood vessels formation was monitored in Tg(fli-1:EGFP) at 3 dpf. Liver (thick white arrow) was present at 3 dpf, but its size is much smaller (A vs. B). In addition, it failed to grow from 3 dpf to 5 dpf or reduced growth was observed compared to control embryos (E–H). ISV (thin white arrow) was disrupted. All the images are lateral view, anterior to the left. Scale bar represents 100 μm for all panels except panels C and D which is 50 μm. (b) Liver formation in hdac3 morphants monitored by WISH with liver marker Ceruloplasmin (Cp) at 32 hpf (A, B), 2 dpf (C, D), 3 dpf (E, F) and 5 dpf (G, H). In hdac3 morphants, Cp expression (white arrow) was absent up to 2 dpf (A, D) whereas a reduced liver was observed at 3 dpf (E, F) and 5 dpf (G, H). All images are dorsal view, anterior to the left. Arrowhead indicates Cp expression in YSL. (c) hdac3 is not involved in pancreas formation. Exocrine and endocrine pancreas were monitored by GFP in Tg(lfabp:RFP; elaA:EGFP) and WISH with insulin, respectively. Control embryos were injected with same amount of 5 bp mismatch morpholino. Both exocrine pancreas (white arrowhead, A–D) and endocrine pancreas (black arrow, E–J) were not affected in hdac3 morphants, whereas liver (red fluorescence, white arrow) was affected (A vs. B). All the images are dorsal view, anterior to left. Scale bar is 50 μm. EXPRESSION / LABELING:
PHENOTYPE:
|
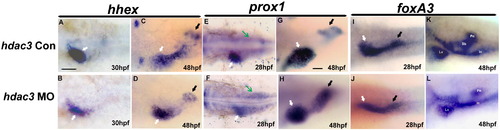
hdac3 is required for early liver formation. WISH with three hepatoblast markers hhex (A–D), prox1 (E–H) and foxa3 (I–L) was analyzed in hdac3 morphants. At 28–30 hpf, hhex expression in liver (white arrow) was greatly reduced in hdac3 morphants (A vs. B). It remained reduced at 48 hpf (C vs. D) whereas its expression in pancreatic islet (black arrow) was less affected. prox1 expression was reduced in liver region at 28–30 hpf (white arrow, E vs. F) and at 48 hpf (G vs. H), while its expression in mesoderm (E and F, green arrow) and pancreas (G and H, black arrow) is less affected. At 28–30 hpf, liver budding (shown as anterior endoderm thickening) was absent in hdac3 MO (I vs. J, white arrow) as judged by foxa3 expression and a reduced liver region was observed at 48 hpf (K, L). foxa3 expression in pancreas region (I, J, black arrow and Pn in K, L) was less affected in both stages. Swim bladder was absent at 48 hpf in hdac3 MO (K vs. L). Lv: liver; Pn: pancreas; in: intestine; Sb: swim bladder. Scale bar represents 100 μm in panels A–F; 50 μm in panels G–L. |
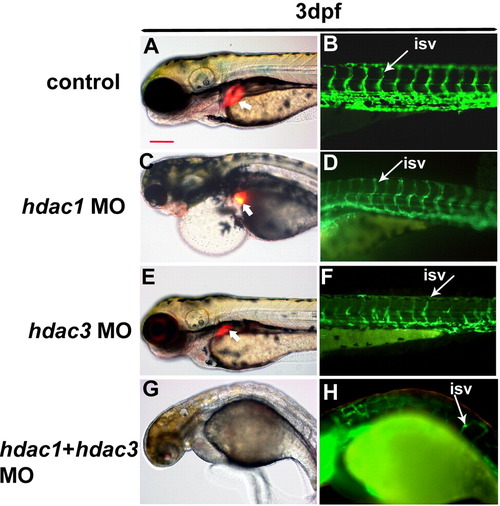
Double knockdown of hdac1 and hdac3 leads to severe defects in embryonic development including liver and blood vessel. Double knockdown of hdac1 and hdac3 was performed by simultaneous injection of both MOs (hdac1 MO at 3 ng/embryo; hdac3 MO at 12 ng/embryo) into Tg(lfabp:RFP; elaA:EGFP) and Tg(fli-1:EGFP) embryos and was compared with the same quantity of 5 bp mismatch morpolinos (control, A–B). Liver (thick white arrow) was absent at 3 dpf and blood vessels (thin white arrow) were severely disrupted. Embryos were severely deformed in the double knockdown morphants (G, H) and they cannot survive beyond 3 dpf. All images were side view, with anterior to the left. Scale bar is 100 μm. EXPRESSION / LABELING:
PHENOTYPE:
|

hdac3 mRNA partially rescued the liver defects in VPA-treated embryos while hdac1 mRNA could not. 5′-capped mRNAs of hdac1 and hdac3 were synthesized in vitro and used to rescue the liver defects in VPA-treated embryos in Tg (lfabp:RFP, elaA:EGFP) by microinjection. Overexpression of hdac1 mRNA (0.3 ng/embryo) did not generate any obvious impact on liver development (C vs. A) and hdac1 mRNA failed to rescue the liver defects in VPA-treated embryos (D vs. B). In contrast, hdac3 mRNA (0.3 ng/embryo) led to a slight increase in liver size compared to control (E vs. A). It also readily rescued the small liver defects in VPA-treated embryos although not to the same size of the control at the doses analyzed (F vs. B). Injection of both hdac1 and hdac3 mRNA together (0.3 ng/embryo each) rescued the liver defect under VPA to similar extent as hdac3 mRNA alone (H vs. B). All images are lateral view of 5 dpf embryos, anterior toward the left. Scale bar is 100 μm. |
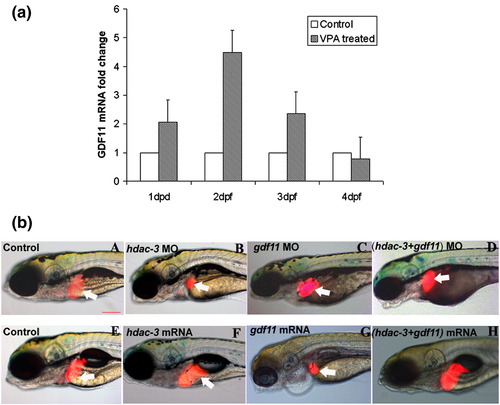
(a) VPA induced gdf11 expression in zebrafish embryos. WT zebrafish embryos were treated with VPA at shield stage and total RNA was extracted at various developmental stages. gdf11 mRNA level was analyzed by real-time RT-PCR. gdf11 mRNA level of the control embryos at each stage is set to be 1. (b) gdf11 neutralized the liver defects induced by hdac3. To confirm that hdac3 suppresses liver growth by suppressing gdf11 gene, a double knockdown of hdac3 and gdf11 as well as simultaneous overexpression of both genes was performed. Knockdown of gdf11 neutralized the effect of hdac3 knockdown (D vs. B). On the other hand, overexpressions of gdf11 lead to a small liver phenotype similar to hdac3 morphants (G vs. E). Simultaneous overexpression of both genes leads to the neutralization of the liver phenotype induced by overexpression of gdf11 alone (H vs. F), although liver in the double overexpression embryos was often not restored to the same size of the control (compare E and H). Liver is indicated by white arrow. All images are lateral view of 5 dpf embryos, anterior to the left. Scale bar is 100 μm. |

gdf11 negatively control exocrine pancreas growth in zebrafish. Pancreas formation was analyzed in gdf11 morphants by insulin (A–F) and elaB (G–H) expression. The endocrine pancreas formation (black arrow) was basically normal in gdf11 MO compared to 5 bp mismatch control morpholino injected embryos. A slight increase in insulin positive area was observed in about 10% of gdf11 MO at 5 dpf (F). elaB positive exocrine pancreas (white arrow) showed obvious increase in the majority of gdf11 MO at 5 dpf (H). Panels A–F are dorsal view while panels G–H are lateral view, anterior to the left. Scale bar is 100 μm. |
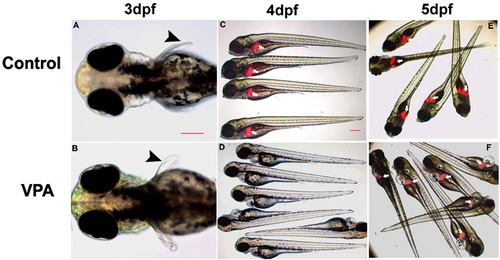
Low concentration VPA (20 μM or bellow) did not generate obvious developmental defects in zebrafish embryos in the first 3 days of development. However, from 3 dpf onward, embryonic defects were observed including pericardial edema. Scale bars are: panel A: 100 μm and panel C: 200 μm. Black arrowhead indicates pectoral fin and white arrow indicates liver. |
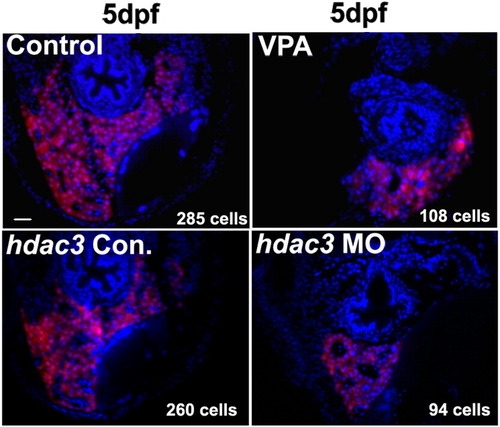
Reduction of liver cells in VPA-treated embryos and hdac3 morphants. Embryos from Tg(lfabp:RFP; elaA:EGFP) are cross-sectioned and liver cells of the largest size section (middle of the liver) are counted under a microscope after DAPI staining. RFP positive and DAPI positive cells are counted as liver cells. Number of cells is indicated at the right bottom corner of each panel and it is the average from 3 embryos of the sample group. Scale bar is 50 μm. EXPRESSION / LABELING:
|

Expression of hdac3 during zebrafish development. White arrowhead indicates liver; white arrow indicates intestinal bulb; black arrow refers to brain. |

Expression of gdf11 during zebrafish development in WT, VPA-treated and hdac3 morphants. (A) Expression of gdf11 in WT and VPA-treated embryos. Green arrow indicates mesoderm expression; red dashed line indicates the section plane. NT: neurotube. (B) Expression of gdf11 in WT and hdac3 morphants. |
Reprinted from Developmental Biology, 317(1), Farooq, M., Sulochana, K.N., Pan, X., To, J., Sheng, D., Gong, Z., and Ge, R., Histone deacetylase 3 (hdac3) is specifically required for liver development in zebrafish, 336-353, Copyright (2008) with permission from Elsevier. Full text @ Dev. Biol.