
- Title
-
The transmembrane inner ear (tmie) gene contributes to vestibular and lateral line development and function in the zebrafish (Danio rerio)
- Authors
- Shen, Y.C., Jeyabalan, A.K., Wu, K.L., Hunker, K.L., Kohrman, D.C., Thompson, D.L., Liu, D., and Barald, K.F.
- Source
- Full text @ Dev. Dyn.
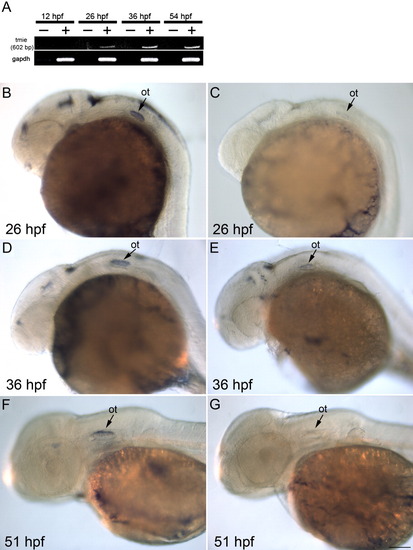
Expression of tmie mRNA in the brain, and ear. A: RT-PCR results from various stages of embryonic development: -, no reverse transcriptase; +, with reverse transcriptase. B,C: Lateral view of 26-hpf embryos with tmie antisense probe (B) and sense probe (C). D,E: Lateral view of 36-hpf embryos with tmie antisense probe (D) and sense probe (E). F,G: Lateral view of 51-hpf embryos with tmie antisense probe (F) and sense probe (G). Signals were found in the developing otic vesicle at all stages observed. There is also staining in the brain. ot, otic vesicle; sc, spinal cord. Scale bar = 100 μm. EXPRESSION / LABELING:
|
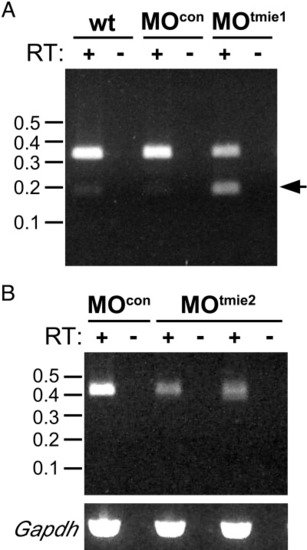
Morpholinos directed against tmie decrease levels of normal transcripts. A: Injection of an anti-tmie morpholino (MOtmie1) directed against the splice donor site of exon 3 resulted in a decreased level of intact transcripts and a substantial increase in shorter tmie transcripts that lacked exon 2 (arrow) at 36 hpf. Very little of the shorter transcript was detected at 36 hpf in uninjected embryos (wt) or in embryos injected with a control morpholino (MOcon). B: Injection of an anti-tmie morpholino (MOtmie2) directed against the splice donor site of exon 2 resulted in decreased levels of intact tmie transcripts at 36 hpf (products amplified from two independent RNA preparations are shown), relative to those present in embryos injected with a control morpholino. Levels of Gapdh transcripts are shown in the bottom panel. Size standards are indicated in kb. |
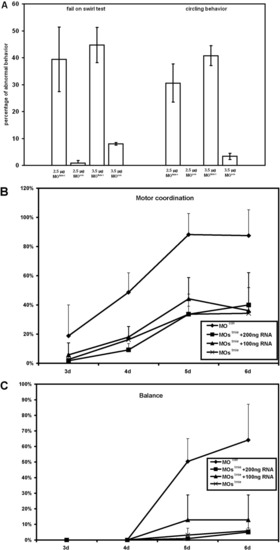
Figure 4. Behavioral assessment of fish. A: Swirl test of embryos at 96 hpf with 2.5 g/l control MO (n = 66), 2.5 g/l MOtmie1 (n = 293), 3.5 g/l MOcon (n = 45), and 3.5 g/l MOtmie1 (n = 152). Development of balance (B) and development of motor coordination (C) in control embryos (MOcon, n = 113), tmie morphants with 2.5 ng of MOs (n = 107), tmie morphants with 2.5 ng MOs plus 100 ng (n = 96) or 200 ng (n = 90) tmie RNA. Data show the means and standard errors of two independent experiments. |

Staining of actin (phalloidin staining, red) and acetylated tubulin (green) in hair cell patches in the inner ear showed defects in tmie morphants. A,B: Double staining of actin (stereocilia) and tubulin (kinocilia) of the three cristae (arrowheads). C,D: Double staining of stereocilia and cristae in the maculae (arrows). E,F: Actin staining showing the epithelial pillars (ep), which form hubs of the developing semicircular canals. Arrows indicate the junction of the ventral bulge (b) and ventral projection (p). In the control ear, the junction has formed and fused (E), but in the tmie MO-treated fish, there is still a gap between the bulge and the projection. G-J: Phalloidin staining of the anterior macula (arrowhead) at 5 dpf (G, H) and 6 dpf (I, J). The patch is smaller in tmie morphants, especially at 6 dpf. K: Numbers of hair cells labeled by phalloidin at 4 dpf (n = 5 for wt, and n = 4 for MOstmie), and as illustrated in G-H at 5 dpf (n = 3 for wt, n = 6 for control, and n = 13 for MOstmie) and 6 dpf (n = 2 for wt, n = 2 for control, and n = 4 for MOstmie). L-O: Acetylated tubulin staining of the posterior macula. PHENOTYPE:
|

The development of lateral line was affected in MOstmie morphants. A-D: DASPEI staining of lateral line neuromasts. There is no or very little staining in MOstmie at 72 hpf (B) compared to the control (A) at the same stage. The lateral staining is weaker at 5 hpf in the MOstmie morphants (D) but present compared to the control larvae (C). E-L: Whole mount in situ hybridization with cxcr4b (E, F, I, J) and ath1 probes (G, H, K, L). Arrows, the migrating lateral line primordium. Arrowheads, the neuromasts with atoh1a signal. M: DASPEI score of the lateral line. After DASPEI staining, the larvae were divided into 3 groups: strongly stained, weakly stained, and not stained. Each fish was assigned a score after the level of staining in all the fish was first observed. Each larva in the strongly stained group was given 2 points, while 1 point was given to the weakly stained larvae, and 0 points to larvae, which were not stained. The number of fish in each group was recorded. The cumulative scores were then calculated and the percentage of fish in each group following each treatment determined. The higher the score (and the closer to 2.0), the stronger the staining of DASPEI observed after each treatment. EXPRESSION / LABELING:
PHENOTYPE:
|

Unillustrated author statements PHENOTYPE:
|