
- Title
-
Ontogeny of vasotocin-expressing cells in zebrafish: Selective requirement for the transcriptional regulators orthopedia and single-minded 1 in the preoptic area
- Authors
- Eaton, J.L., Holmqvist, B., and Glasgow, E.
- Source
- Full text @ Dev. Dyn.

arginine vasotocin-neurophysin (avt) mRNA expression in the zebrafish embryo.A-F: Expression of avt mRNA (dark blue) determined by whole-mount in situ hybridization (ISH). G-I: Expression of avt (purple) and isotocin (ist) mRNA (red) determined by double-label ISH. A-C and J-L are lateral views, dorsal is up, and anterior to the left. D,E: Frontal views, dorsal is up. F-I: Ventral views, anterior is up. The eyes have been removed from the embryo show in C. The ages of the embryos are indicated in the lower left corner in hours postfertilization (hpf) or days postfertilization (dpf). The probes are indicated in the upper right corner. The avt-expressing cell groups in the ventral hypothalamus are indicated by black arrows, whereas the avt cell group in the dorsal preoptic area is indicated with a black arrowhead. The ist-expressing cells are indicated with a white arrowhead. I is a higher magnification of the region outlined by the white box in H. hy, hypothalamus; m, midbrain; t, telencephalon. Scale bars = 100 μm. |
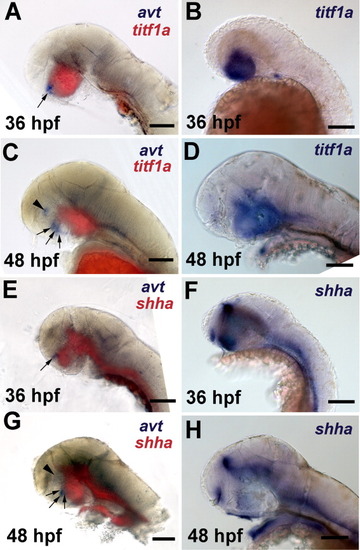
A-E: The avt-expressing cells of the ventral hypothalamus are located at the edges of the shha and titf1a expression domains. Coexpression of avt, titf1a, and shha mRNA was determined by double-label in situ hybridization (ISH). Lateral views, dorsal is up and anterior to the left. The age of the embryos is indicated on each panel in hours postfertilization (hpf). A,C,D,E,G,H: The eyes have been removed. The identity and color of the probes are indicated on each panel. A,C,E,G: Images are merged composites of brightfield and epifluorescence images. The avt-expressing cell groups in the ventral hypothalamus are indicated by black arrows, whereas the avt cell group in the dorsal preoptic area is indicated with a black arrowhead. Scale bars = 100 μm. |
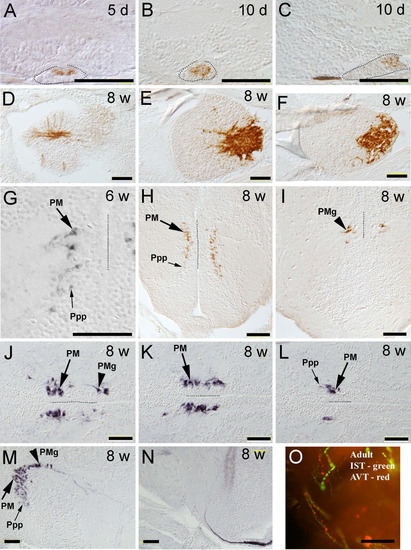
Ontogeny of arginine-vasotocin immunoreactivity (AVTir). The ontogeny of AVT nonapeptide expression was determined by chromogen immunohistochemistry using anti-teleost AVT antibodies. A: AVTir is first detected in the pituitary of larvae at 5 days postfertilization (d), frontal section. B,C: Frontal section (B) and sagittal section (C) show increased immunoreactivity (AVTir) in the pituitary at 10 days. The black dotted lines indicate the approximate outline of the pituitary, A-C. D-F: Horizontal sections at the level of the pituitary in 8-week-old (w) juveniles with rostral to the left, D is the most dorsal and F most ventral. D: AVTir fibers (neurohypophysial tract) entering the pituitary and partly spreading laterally. E: AVTir fibers and terminals in the dorsal and posterior pituitary. F: AVTir terminals restricted to the posterior portion of the pituitary. G: High magnification frontal section of 6-week juveniles, showing AVTir cell bodies and fibers. H-N: Sections demonstrate AVTir at the level of preoptic and hypothalamic areas of 8-week juveniles. H,I: Fritary. G: High magnification frontal section of 6-week juveniles, showing AVTir cell bodies and fibers. H-N: Sections demonstrontal sections, which most rostrally (H) show the dorsal (up) to ventral extent of parvocellular (Ppp; small arrows) and magnocellular (PM; large arrow) AVTir cells, and more caudally (I) shows gigantocellular neuronal subpopulation (PMg; arrowhead). J-L: Horizontal sections, rostral to the left, with J at the most dorsal level with both magnocellular and gigantocellular subpopulations, K and L with only magnocellular nucleus at mid- and the most ventral level. A dotted black line indicates the diencephalic ventricle in G-L. M and N are sagittal sections, rostral to the left. M: AVTir cells form an inverted L shape typically seen in teleosts and AVTir fiber bundles of the neurohypophysial tract course in a caudal-ventral direction of the hypothalamus. N: AVTir fiber bundles of the neurohypophysial tract course in the lateral portion of the hypothalamus toward the pituitary. O: Double-label immunofluorescence of a thick, frontal section of adult brain (30 μm) at the level of the rostral hypothalamus. AVTir (red) fibers and isotocin (IST) -immunoreactive (green) fibers course together through the lateral portion of the hypothalamus. Scale bars = 50 μm. |
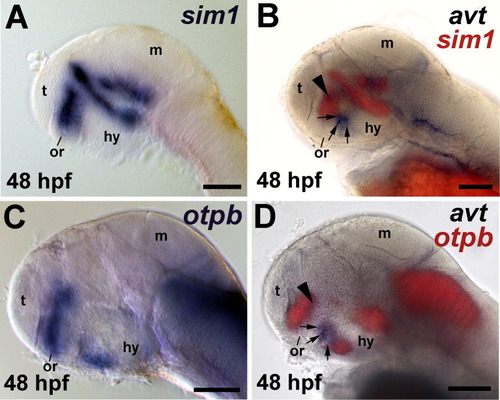
A,C: avt, sim1, and otpb are coexpressed in the dorsal preoptic area, but not in the ventral hypothalamus. avt and sim1 mRNA coexpression, and, avt and otpb coexpression was determined by double-label ISH. Lateral views, dorsal is up and anterior to the left, eyes have been removed. The ages of the embryos are indicated in the left corner in hours postfertilization (hpf). The identity and color of the probes are indicated on each panel. B,D: Images are merged composites of brightfield and epifluorescence images. The avt-expressing cell groups in the ventral hypothalamus are indicated by black arrows, while the avt cell group in the dorsal preoptic area is indicated with a black arrowhead. The location of the optic recess (or) is indicated by a black bar. hy, hypothalamus; m, midbrain; t, telencephalon. Scale bars = 100 μm. EXPRESSION / LABELING:
|

sim1 and otpb are required for avt mRNA expression in the dorsal preoptic area. avt mRNA was detected by in situ hybridization histochemistry (ISH) in embryos that were injected with morpholino oligonucleotides (MO). A,C: Embryos injected with 0.5 ng of a sim1 four-base mismatch control MO (sim1 4mmMO). B,D: Embryos injected with 0.5 ng of sim1 MO. E,G: Embryos injected with 0.5 ng of an otpb four-base mismatch control MO (otpb 4mmMO). F,H: Embryos injected with 0.5 ng of otbp MO. A,B,E,F: Lateral views, dorsal is up, anterior to the left. C,D,G,H: Ventral views, anterior is up. The ages of the embryos are indicated in hours post fertilization (hpf). The avt-expressing cell groups in the ventral hypothalamus are indicated by black arrows, while the avt cell group in the dorsal preoptic area is indicated with a black arrowhead. E,F: The eyes have been removed. A brown shadow from the eye lens is present in A, but the avt-expressing cells are stained dark blue and are indicated with arrows. hy, hypothalamus; m, midbrain; t, telencephalon. Scale bars = 100 μm. |