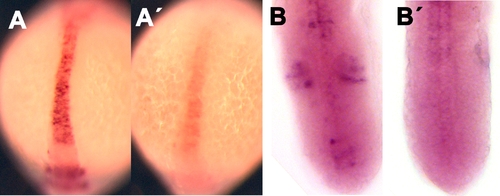
DAPT Treatment Blocks Notch Signalling Rapidly
DAPT causes loss of her4 expression (A) in the neural tube and (B) in the anterior PSM (where her4 is normally expressed in a faint but detectable stripe). Wild-type embryos were treated with 100 μm DAPT or with DMSO (control) medium for 1 h and stained by ISH for her4. In each panel, the DMSO control is shown on the left, the DAPT-treated embryo on the right. Treatment was begun at the 13-somite stage for (A) and at the 15-somite stage for (B). For each case, at least 14 embryos were examined, and typical specimens were selected for this illustration.

EXPRESSION / LABELING:
Gene:
Fish:
Condition:
Anatomical Terms:
Stage: 14-19 somites

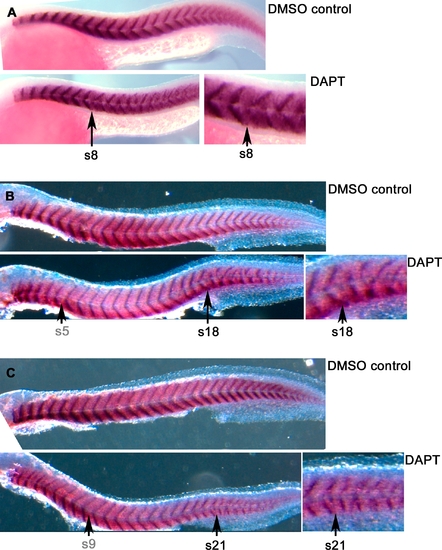
Blocking Notch Signalling Causes Somite Boundary Defects after a Long Delay
Embryos were treated with 100 μm DAPT or with DMSO (control) medium and stained by ISH for titin at the end of somitogenesis to reveal somite boundaries. Treatment was begun (A) at 3 hpf, (B) at 5-somite stage, or (C) at 9-somite stage. Arrows with grey labels indicate stage at onset of DAPT treament; arrows with black labels indicate the level of the earliest defective somite. A detailed view of the region where disruption begins is shown to the right of each DAPT specimen.

EXPRESSION / LABELING:
Gene:
Fish:
Condition:
Anatomical Term:
Stage: 26+ somites

DAPT Treatment Disrupts Synchronized Oscillations of her1 within 3–4 h
Wild-type embryos were treated with 100 μm DAPT or with DMSO (control) medium and stained by ISH for her1 for 2, 3, 4, or 5 h, as indicated. The rightmost panel is a detail of the 4-h specimen, showing the chaotic pattern of expression of her1. Treatment was begun at the 16-somite stage. For each case, at least 14 embryos were examined, and typical specimens were selected for this illustration.

EXPRESSION / LABELING:
Gene:
Fish:
Condition:
Anatomical Term:
Stage Range: 14-19 somites to 20-25 somites

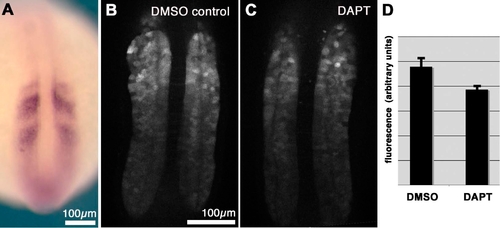
Effect of Loss of Notch Signalling on the Expression of a GFP Reporter for her1
(A) ISH staining for gfp mRNA in a transgenic embryo shows a pattern of expression similar to the normal her1 expression pattern.
(B) GFP fluorescence of a transgenic embryo in the living state treated with DMSO (control), as seen by confocal microscopy in an optical section. Note that the magnification is higher than in (A), and the optical section shows only the PSM.
(C) Corresponding embryo treated with DAPT and imaged in the same way as in (B).
(D) Measured average fluorescence intensities in the PSM of transgenic embryos containing the reporter, after treatment with either 100 μM DAPT or DMSO (control) medium. Treatment was from 5.5 hpf up to 16-somite stage. Fluorescence levels were lower in the DAPT-treated embryos than in the controls by a factor of 0.81 ± 0.07 (mean ± SEM, n > 12 embryos of each type). Error bars show standard error of the mean.

EXPRESSION / LABELING:
Gene:
Fish:
Condition:
Anatomical Term:
Stage: 14-19 somites

Overactivation of the Notch Pathway by NICD Causes Somite Boundary Defects After a Long Delay
NICD overexpression was induced by 30-min heat shock in hsp70:Gal4VP16;UAS:myc-notch1aICD transgenic embryos.
(A,A′) One hour after the end of a heat shock (delivered at the 16-somite stage), her4 expression is strongly induced in the neural tube and other tissues, including the PSM (C,C′).
(B) An embryo heat-shocked at 10 hpf, showing disturbances of somite boundary formation only after a long delay (as with DAPT treatment). The start of the boundary defects is marked by the arrow.
(D,D′) Embryos heat-shocked at the five-somite stage, fixed 2.5 h later, and stained by ISH for her1.
(E,E′) Embryos heat-shocked at the 16-somite stage, fixed 3 h later, and stained by ISH for her7. For both her1 and her7, the stripy pattern seen in the controls is replaced by more uniform expression in the transgenic embryos, implying a breakdown of synchronized oscillation. Note that the levels of her1 and her7 expression in the transgenic embryos are lower than the peak levels in the normal controls. For each case in (A) to (E), at least 14 embryos were examined and typical specimens were selected for this illustration.

EXPRESSION / LABELING:
Genes:
Fish:
Condition:
Anatomical Terms:
Stage Range: 5-9 somites to 14-19 somites
Acknowledgments
This image is the copyrighted work of the attributed author or publisher, and ZFIN has permission only to display this image to its users. Additional permissions should be obtained from the applicable author or publisher of the image. Full text @ PLoS Genet.