

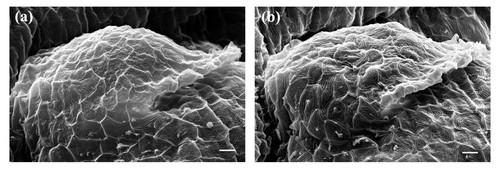
Face, animal-vegetal axis rotated and top views of (a) 2-cell stage embryo and (b, c) 8-cell stage embryo. (d, e) High magnification SEM images of the blastomere-yolk interface of an 8-cell stage embryo. Scale bar for (a, b, c) is 100 μm and (d, e) 5 μm. |

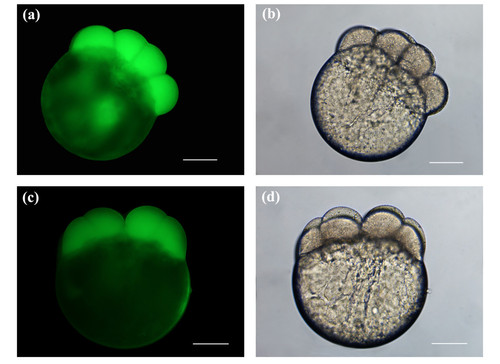
Laser-manipulated embryos porated for exogenous FITC delivery using an average laser power of 45 mW. (a, b) Fluorescence and brightfield image of a post-laser manipulated 8-cell stage embryo. A total of 6 pores were made in 2 cells, 3 pores per blastomere, using a beam dwell time of 100 ms and 3 pulsing events of the galvo. (c, d) Fluorescence and brightfield image of a post-laser manipulated 4-cell stage embryo. Same number of pores were made in the blastomeres as indicated in (a, b). Beam dwell time was set to 100 ms and the galvo was pulsed once. Scale bars for (a, b, c, d) represent 200 μm. |
Fluorescence and brightfield images of post-laser manipulated 8-cell stage embryos. Embryos were porated for exogenous FITC delivery using an average laser power of 45 mW. The beam dwell time was set to 50 ms with three pulsing events of the galvo for (a, b) and two for (c, d). Three pores were made in each of 2 blastomere cells, yielding a total of six pores for the entire embryo. Scale bars for (a, b, c, d) represent 200 μm. |

Fluorescence and brightfield image of a post-laser manipulated embryo at 8-cell stage. (a, b) Embryo was porated for exogenous delivery using an average laser power of 45 mW with a beam dwell time set to 20 ms and a galvo pulse rate of three. Three pores were made in each of 2 blastomere cells, yielding a total of six pores for the entire embryo. Scale bars for (a, b) represent 200 μm. |

(a, b) Fluorescence and brighfield image of an 8-cell stage embryo that was not laser-manipulated, but was bathed in a concentration of 0.014 to 0.018 mg/ml FITC-tank water for 10 to 15 min. The embryo was rinsed several times in fresh tank water and subsequently imaged with an imaging area and exposure time consistent with Figures 3, 4 and 5. No FITC dye was observed in the blastomere cells. (a) Weak autofluorescence was observed in the yolk. Scale bars for (a, b) represent 200 μm. |

(a, b, c, d) Depicts cavitation bubbles (Cb) and residual surface scarring (Ss) after the applied fs laser pulses. (a) Cavitation bubble (Cb) was produced using an average laser power of 45 mW with a beam dwell time of 100 ms and a single pulsing event of the galvo. The diameter of the cavitation bubble was measured to be ∼5 μm. (b) After pulsing the galvo a total of 3 times, surface scarring (Ss) of the blastomere was observed. The spatial extent of tissue scarring was measured to be ∼5 μm. (c) Depicts the cavitation bubble (Cb) created using an average laser power of 45 mW with a beam dwell time of 500 ms and a single pulsing event of the galvo. Diameter of the cavitation bubble was measured to be ∼10 μm. (d) After pulsing the galvo a total of 2 times, surface scarring (Ss) of the blastomere was observed. The spatial extent of tissue scarring was measured to be ∼10 μm. (a, b, c, d) Still images were extracted from additional file 1. Scale bars for (a, b, c, d) represent 5 μm. |
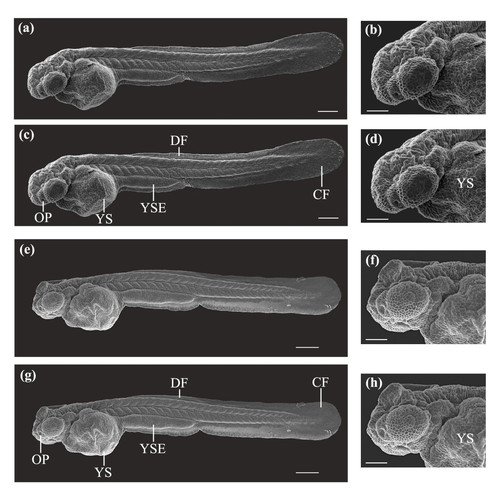
SEM images of a laser-manipulated and a control larva reared to 2 dpf. (a, b) Whole body and antero-lateral views of a laser-manipulated larva at 2 dpf. (c, d) Same larva as in (a, b). Key developmental features that are illustrated are the yolk sac (YS), yolk sac extension (YSE), dorsal fin (DF), caudal fin (CF) and the olfactory pit (OP). (e, f) Whole body and antero-lateral views of a control larva at 2 dpf. (g, h) Same larva as in (e, f). The same developmental features observed in (c, d) were also seen in (g, h). Scale bars for (a, c, e, g) represent 200 μm and for (b, d, f, h) 100 μm. |

SEM images of laser-manipulated and control larvae reared to 7 dpf. (a, b, c, d) Dorso-lateral whole body views and antero-dorsal views of laser-manipulated larvae at 7 dpf. (e, f, g, h) Dorso-lateral whole body views and antero-dorsal views of control larvae at 7 dpf. Scale bars for (a, c, e, g) represent 200 μm and for (b, d, f, h) 100 μm. |

Key developmental features in a laser-manipulated and a control larva reared to 7 dpf. (a) SEM whole body image of a laser-manipulated larva at 7 dpf. Developmental features indicated are the ventral fin (VF), notochord (NC), pectoral fin (PF), otic capsule (OC), otic vesicle (OV), eye (E; cornea), olfactory pit (OP) and the protruding mouth (PM). (b) Magnified antero-dorsal view of the protruding mouth (PM), olfactory pit (OP), eye (E; cornea), otic capsule (OC) and otic vesicle (OV) of the larva in (a). (c) SEM whole body image of a control larva at 7 dpf. Similar developmental features observed in (a) were also seen in (c). (d) Magnified antero-lateral view of the same larva in (c). Developmental features illustrated in (b) are also shown in (d). Scale bars for (a, c) represent 200 μm and for (b, d) 100 μm |

Magnified top and lateral SEM images of key developmental features in larvae reared to 7 dpf. (a, b, c) Depict the olfactory pit, ear, posterior forebrain and dorsal midbrain in laser-manipulated larvae. (d, e, f) Depict the olfactory pit, ear, posterior forebrain and dorsal midbrain in control larvae. (g, h) Illustrated comparison of dorso-lateral views of the posterior forebrain and dorsal midbrain in (g) a laser-manipulated and (h) a control larva at 7 dpf. Location of the eye (E), diencephalon (D) and optic tectum (OT) are shown respectively. Scale bars for (a, d) represent 20 μm and for (b, c, e, f, g, h) 50 μm. Orientation: anterior (left); posterior (right). |
SEM images depicting the pectoral fin bud in larvae reared to 2 dpf. (a) Pectoral fin bud of a laser-manipulated and (b) a control larva at 2 dpf. Scale bar represents 10 μm. Orientation: anterior (left); posterior (right). |
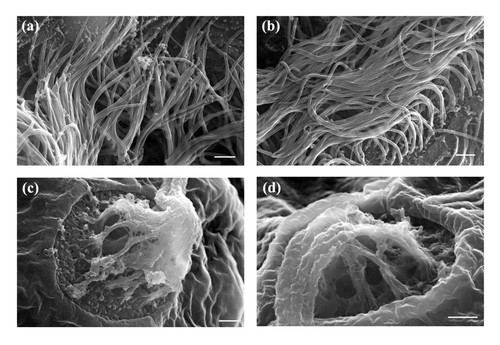
High magnification SEM images of the olfactory pit rim and kinocilia projecting from cristae on the lateral wall into the lumen. (a) Olfactory pit rim in a laser-manipulated and (b) a control larva showing kinocilia covering the inside wall of the olfactory pit. Kinocilia projecting from lateral cristae in (c) a laser-manipulated and (d) a control larva. Scale bars for (a, b, c, d) represent 1 μm. |