
- Title
-
Genomewide Expression Analysis in Zebrafish mind bomb Alleles with Pancreas Defects of Different Severity Identifies Putative Notch Responsive Genes
- Authors
- Hegde, A., Qiu, N.C., Qiu, X., Ho, S.H., Tay, K.Q., George, J., Ng, F.S., Govindarajan, K.R., Gong, Z., Mathavan, S., and Jiang, Y.J.
- Source
- Full text @ PLoS One
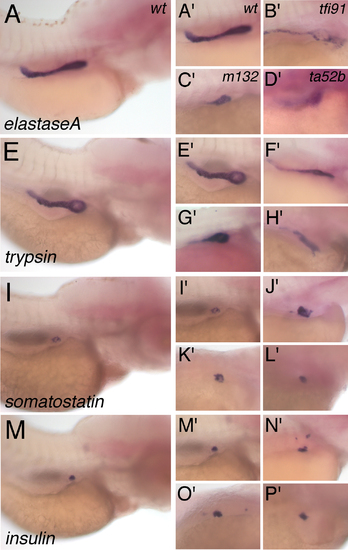
Expression pattern of pancreas-specific genes at 96 hpf in mib mutants and their wild type (wt) siblings. The RNA probes used for in situ hybridization are (A and A′–D′) elastaseA, (E and E′–H′) trypsin, (I and I′–L′) somatostatin and (M and M′–P2) insulin. The genotypes are (A, A′, E, E′, I, I′, M and M′) wt, (B′, F′, J′ and N′) mibtfi91, (C′, G′, K′ and O2) mibm132 and (D′, H′, L′ and P′) mibta52b. A′, E′, I′ and M′ are cropped from A, E, I and M, respectively. All panels are lateral views and anterior to the right. EXPRESSION / LABELING:
|

elastaseA-GFP, insulin-GFP and pdx1-GFP expression in embryos of mib mutant alleles and their wt siblings. Expression of elastaseA-GFP in (A) wt, (B) mibtfi91, (C) mibm132 and (D) mibta52b embryos was analyzed at 96 hpf. Expression of insulin-GFP in (E and E′) wt, (F′) mibtfi91, (G′) mibm132 and (H′) mibta52b embryos was analyzed at 72 hpf. Expression of pdx1-GFP in (I and I′) wt, (J′) mibtfi91, (K′) mibm132 and (L′) mibta52b embryos was analyzed at 72 hpf. Panels A–D are lateral views and the rest are dorsolateral views, oriented anterior to the right. EXPRESSION / LABELING:
|
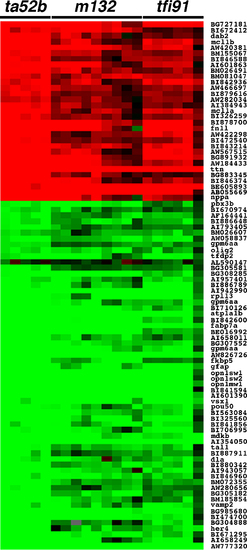
Gene expression profile of 91 differentially expressed (q = 0.0, score(d)>4.0) genes (Genbank ID) common to all three mib mutant alleles at 72 hpf. At least two biological repeats and two technical repeats were carried out for each mutant allele. Each horizontal strip represents expression of a single gene. Color in each cell reflects the expression level of corresponding gene in the respective sample. The up-regulation is shown in red and the down-regulation in green. Grey cells indicate the missing values. The median log2 ratio values for differential expression ranged between -4.07 and 3.32. Note: The gene symbols are mentioned instead of Genbank IDs, where the gene symbols corresponding to the Genbank IDs are available in the Zebrafish Chip Annotation Database. Three Genbank IDs, BI840762, BI839927 and BG306150, encode the same gene, gpm6aa. |

Validation of expression profile of differentially expressed genes with fluorescent double in situ hybridization. Expression of down-regulated genes: (A and B) isl1, (C and D) cad and (E and F) wu:fb59c09 and up-regulated genes: (G and H) spon1b and (I and J) isl3 in (B, D, F, H and J) mibta52b mutants embryos and (A, C, E, G and I) wild-type embryos. Left panels show respective gene expression in green; middle panels show insulin (endocrine) or trypsin (exocrine) expression in red; right panels show merged pictures. Expression of wu:fb59c09 is shown in 4-dpf embryos, and the rest are in 3-dpf embryos. All embryos are anterior to the left and ventral views. EXPRESSION / LABELING:
|

Unillustrated author statements EXPRESSION / LABELING:
|