
- Title
-
Noggin1 and Follistatin-like2 function redundantly to Chordin to antagonize BMP activity
- Authors
- Dal-Pra, S., Fürthauer, M., Van-Celst, J., Thisse, B., and Thisse, C.
- Source
- Full text @ Dev. Biol.
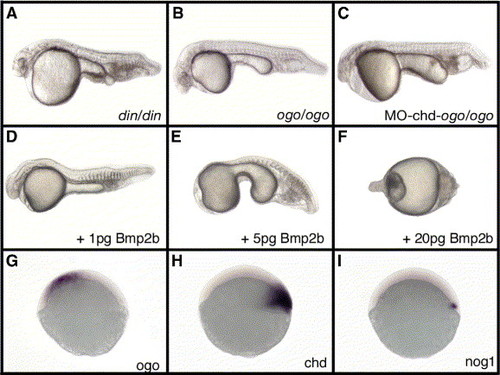
Comparative analysis of ventralization phenotypes. Homozygous mutant embryos for chordin (din/din, panel A), ogon (ogo/ogo, panel B) as well as chd morphants in ogon mutant background (C) display ventralization phenotypes similar to those obtained after injection of low amount of bmp2b RNA (1 pg, panel D). Injection of 5 pg bmp2b RNA (E) results in stronger ventralization with complete loss of head while injection of 20 pg RNA (F) completely abolishes the D/V patterning and embryos appear radialized. At the onset of gastrulation, ogo transcripts (G) are observed in the ventral part of the embryo while chd (H) is expressed in a broad dorsal domain, which includes the nog1 expression territory (I). Embryos are in lateral view, anterior to the left (A–F) or anterior to the top (G–I). EXPRESSION / LABELING:
PHENOTYPE:
|

noggin1 morphants display normal D/V patterning. Compared to wild-type at 30 hpf (A), MO-nog1-injected embryos (B) display normal D/V axis, but a thinner yolk tube extension (arrowhead) and a protruding telencephalon. At higher magnification, cerebellum (arrowhead in panel D) appears smaller compared to wild-type (arrowhead in panel C). Lateral views, anterior to the left. PHENOTYPE:
|
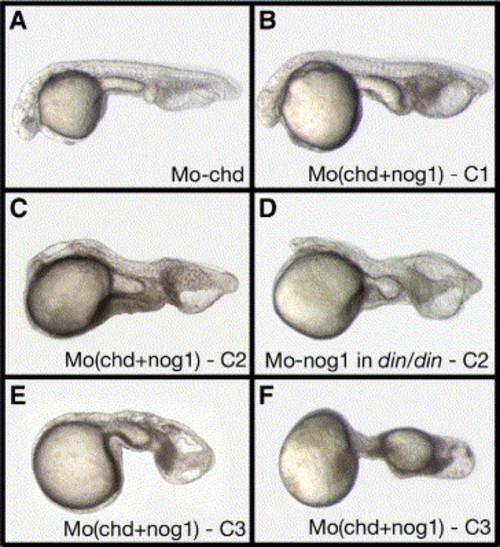
Inactivation of noggin1 enhances the ventralization phenotype of chordin loss of function. (A) MO-chd-injected embryos at 30 hpf. (B–F) Injection of MO-chd together with MO-nog1 leads to (B) class 1 (C1) embryos corresponding to a weak enhancement of chd phenotype. In class 2 (C2) embryos, the ventralization phenotype following (C) injection of MO-chd and MO-nog1 or (D) injection of MO-nog1 in chordino (din/din) mutant is more pronounced than in class 1, with loss of most of the head territory. (E, F) In class 3 (C3) embryos, the ventralization after double chd-nog1 MO injection is stronger with an almost complete disappearance of anterior and dorsal territories. Lateral views, anterior to the left. PHENOTYPE:
|

Analysis of double chordin–noggin1 morphants for the expression of tissue-specific molecular markers at 30 hpf. Expression at 30 hpf of three different molecular markers, sox19 labeling the central nervous system, starmaker labeling the otic vesicle and im:7144261 labeling the notochord. (A, E, I, M) Wild-type embryos while the others embryos are injected with MO-chd and MO-nog1 in conditions described in Table 2. (B, F, J, N) Weak aggravation (class I, CI) of the ventralization phenotype, (C, G, K, O) strong ventralization—class II—CII, and (D, H, L, P) extreme ventralization (class 3, CIII). Embryos in lateral view (A–D), (M–P). In dorsal view (E–L), anterior to the left. |

Analysis of double chordin–noggin1 morphants for the expression of early molecular markers. Expression of ved (A–C), a Bmp target gene expressed in the ventral part of the gastrula, cyp26a (D–F) expressed at the margin and in anterior neural plate, foxi1 (G–I), a marker of presumptive epidermis at gastrula stage. (A, D, G) Wild type (WT), (B, E, H) injection of 100 μM of MO-chd (class I, CI), (C, F, I) injection of 100–800 μM chd-nog1 MOs (class II, CII). Arrowheads in panels A–C indicate the dorsal limits of ved expression. Arrowheads in panels D–F indicate the anterior limit of the neural plate labeled with cyp26a and arrowheads in G–I, the dorsal limits of the presumptive epidermis labeled with foxi1. Embryos are in animal pole view dorsal to the right in panels A–C and G–I upper panels. Dorsal views animal pole up in panels D–E and G–I lower panels. EXPRESSION / LABELING:
|
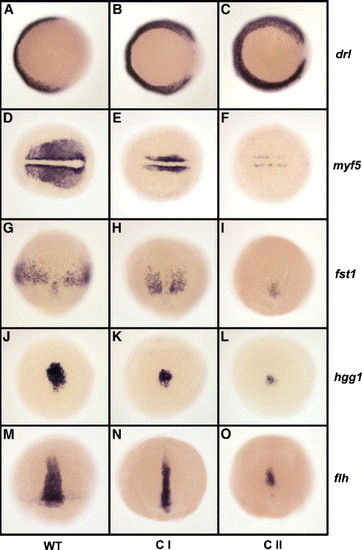
Analysis of double chordin–noggin1 morphants with endomesodermal markers. (A–C) Expression of draculin (drl) specific of presumptive hematopoietic territory at 70% epiboly. (D–F) Expression of the paraxial marker myf5 at the 3-somite stage. (G–I) Expression of the cephalic mesendodermal marker follistatin1 (fst1) at 80% epiboly. (J–L) Expression of the prechordal plate marker hgg1 which labels the presumptive hatching gland at 75% epiboly. (M–O) Expression of the notochordal marker floating-head (flh) at 75% epiboly. (A, D, G, J, M) Wild-type embryos (B, E, H, K, N), 100 μM MO-chd-injected embryos (C, F, I, L, O) 100–800 μM chd-nog1 MOs-injected embryos. (A–C) Vegetal pole views, dorsal to the right. (D–F) Dorsal views anterior to the left. (G–O) Dorsal views, animal pole up. EXPRESSION / LABELING:
|
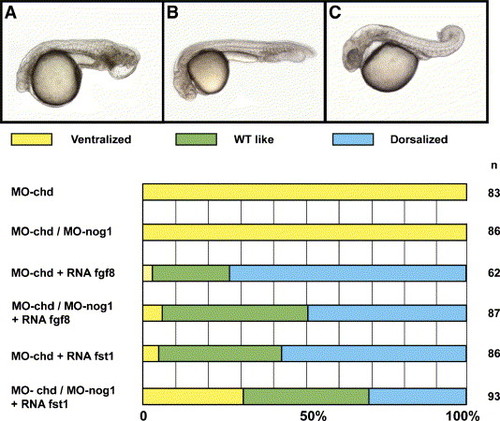
Fgf8 and Fst1 overexpression rescues chordin and chordin–noggin1 morphants. (A) Example of a ventralization phenotype observed after injection of chd or chd-nog1 morpholinos. (B) Example of wild-type like morphology obtained after injection of fgf8 or fst1 RNA into chd or chd-nog1 morphants (C). Example of a dorsalization phenotype observed after injection of fgf8 or fst1 RNA into chd or chd-nog1 morphants. Embryos are observed at 30 hpf in lateral view, anterior to the left. Lower panel: the horizontal bars represent the percentage of embryos displaying a ventralized phenotype (yellow), a wild-type like morphology (green) or a dorsalized phenotype (blue) in chd morphants (MO-chd, 100 μM), double chd-nog1 morphants (MO-chd/MO-nog1—100 μM/800 μM), in chd or chd-nog1 morphants injected with 5 pg of fgf8 RNA (MO-chd + RNA fgf8; MO-chd/MO-nog1 + RNA fgf8, respectively) or with 50 pg of fst1 RNA (MO-chd + RNA fst1; MO-chd/MO-nog1 + RNA fst1, respectively). Due to the lack of two Bmp inhibitors, the rescue of ventralization phenotype (wild-type-like and dorsalized phenotypes) by fgf8 and fst1 is less efficient in double chd-nog1 morphants than in single chd morphants. n: number of embryos analyzed. PHENOTYPE:
|

Follistatin-like 2 (Fstl2) is involved in the control of the D/V axis formation. (A) Expression of fstl2 starts at the onset of gastrulation in the deep cells of the embryonic shield (sh). (B) At 60% epiboly, fstl2 transcripts are observed in notochord (n) as well as in the yolk syncytial layer (ysl). (C–D) At 75% epiboly, expression is restricted to the notochord. (E) Morphological analysis of morphant phenotypes at 30 hpf. Single fstl2 or nog1 morphants as well as double fstl2–nog1 morphants display D/V axis similar to wild-type (WT like). Chd morphants or mutants display a ventralization phenotype characterized by a small head and an enlarged hematopoietic territory (C1). Double chd-fstl2; chd-nog1 or triple chd-fstl2-nog1 morphants display stronger ventralization phenotype with very small head and strong enlargement of ventro-posterior territories (C2) or an extreme ventralization phenotype with lack of head (C3). Graphs underneath each picture represent the percentage of embryos observed for the corresponding class observed for the different combination of morpholino injected described in the table in panel H. (F) Analysis of single, double and triple morphants with ved, a marker of ventral territories at gastrula stage. Embryos are in vegetal pole view, dorsal to the right. Whereas at 50% epiboly, in wild-type, ved is detected in the ventral part of the gastrula, in CI, expression of ved is expanded towards dorsal. In CII, this enlargement is even more pronounced. (G) Analysis by in situ hybridization of single, double and triple morphants using cyp26a, a marker of margin and of anterior neural plate at gastrula stage. Embryos are in lateral view, animal pole up. Compared to wild-type-like embryos, in CI, the anterior neurectodermal territory labeled with cyp26a appears strongly reduced while it is almost absent in CII. (I) For the different combinations of morpholinos used, the table records the number and the percentage of embryos for the classes described in panels F and G and analyzed by in situ hybridization with ved and cyp26a. EXPRESSION / LABELING:
PHENOTYPE:
|

Expression pattern of follistatin2 during embryonic development. (A) Side view of an embryo at the 18-somite stage showing expression of fst2 in anterior somites (s). This expression, first observed at the 14-somite stage is maintained until 24 hpf, appearing progressively in more posterior somites. (B) Transverse section of the trunk region of the embryo shown in A. Fst2 is expressed in the proximal part of the somite (ps) but is excluded from the myoseptum (ms) and from the distal part of the somite (ds). (C) Side view and (D) front view of the embryo head at 48 hpf showing a weak expression of fst2 in part of first and second branchial arches (ba). Anterior to the left in A and C. Dorsal up in B and D. n: notochord, nt: neural tube. EXPRESSION / LABELING:
|

Expression pattern of follistatin-like 2 during embryonic development. (A) Expression of fstl2 starts at the onset of gastrulation in the deep cells of the embryonic shield (sh). (B) At 60% epiboly, fstl2 transcripts are observed in notochord (n) as well as in the yolk syncytial layer (ysl). (C–D) At 75% epiboly and bud stage (E–F), expression is restricted to the notochord. (G–I) At the 7-somite stage, fstl2 expression is observed in notochord as well as in segmental plate (sp) with a stronger staining in the adaxial cells (ad) of the formed somites. Expression is also observed in hindbrain (h). (J) At the 18-somite stage, expression is observed in hindbrain rhombomeres (rh) 2, 4 and 6, somites (s) and in tail epidermis (te). (K–L) At 24 hpf, transcripts accumulate in the choroid fissure (cf), at the rhombomeres boundaries (rhb) in axial vasculature (av) and in posterior somites. (M–N) At 36 hpf, additional expression is observed in forebrain ventricular zone (fv) and epiphysis (ep). (O–P) At 48 hpf, expression is also observed in branchial arches (ba), head mesenchyme (hm) and pectoral fin (pf). Embryos in lateral views anterior to the top in A, B, D and F; in dorsal views anterior to the top in C and E; in lateral views anterior to the left in G and J–O and in dorsal views anterior to the left in H, I and P. EXPRESSION / LABELING:
|

Expression pattern of follistatin-like 1 during embryonic development. (A, B) Expression of fstl1 starts at the beginning of somitogenesis in adaxial cells (ad), anterior somites and ventral mesenchyme (vm). (C–E) At the 15-somite stage, expression of fstl1 is observed in somites (s) and hindbrain neurons (hn), in ventral mesoderm (vm) as well as in hypochord (hy). At 24 hpf (F–G), expression is observed in tegmentum (tg), cerebellum (ce), hindbrain, floor plate (fp) and hypochord in median fin fold (mff). A weak expression is also observed in somites and in ventral mesenchyme (vm). At 36 hpf (H–L), fstl1 is expressed in tegmentum, cephalic floor plate (cfp) and dorsal part of hypothalamus, in cerebellum, in hindbrain, in a subpopulation of cell of branchial arches (ba), hypochord and median fin fold. At 48 hpf (M–P), fstl1 is expressed in neurocranium (nc), central part of pectoral fins (pf), apical ectodermal ridge of pectoral fins (aer), caudal hypochord and median fin folds. Embryos in dorsal views, anterior to the left in A, B, D, E, J, K and N–P and in lateral views, anterior to the left in C, F–I, L and M. EXPRESSION / LABELING:
|

Unillustrated author statements |
Reprinted from Developmental Biology, 298(2), Dal-Pra, S., Fürthauer, M., Van-Celst, J., Thisse, B., and Thisse, C., Noggin1 and Follistatin-like2 function redundantly to Chordin to antagonize BMP activity, 514-526, Copyright (2006) with permission from Elsevier. Full text @ Dev. Biol.