
- Title
-
Heat-shock protein 90alpha1 is required for organized myofibril assembly in skeletal muscles of zebrafish embryos
- Authors
- Du, S.J., Li, H., Bian, Y., and Zhong, Y.
- Source
- Full text @ Proc. Natl. Acad. Sci. USA

Temporal and spatial expression of Hsp90α1 and Hsp90α2 in zebrafish embryos. (A–D) Muscle-specific expression of Hsp90α1 in somites and skeletal muscles at 13 (A and B) and 24 hpf (C and D). (A and B) Dorsal view of anterior (A) and posterior (B) regions of a 13-hpf embryo. (C and D) Side (C) and dorsal (D) view of a 24-hpf embryo. The enzymatic reaction was carried out for 3 h during the whole-mount in situ hybridization. (E and F) Longer in situ staining (12 h) shows the cardiac expression of Hsp90α1 (arrow in E) in comparison with the cardiac muscle specific expression of myosin light chain (F). A weak staining of Hsp90α1 was also found in the brain and eye regions (E). (G and H) Cross (G) and horizontal (H) sections showing the muscle-specific expression of Hsp90α1 in zebrafish embryos at 24 hpf. (I–L) Expression of Hsp90α2 in somites, skeletal muscles and other tissues at 13 (I and J) and 24 hpf (K and L). In addition to muscle expression, Hsp90α2 expression was also detected in the head and eye regions (I). The enzymatic reaction was carried out for12 h during the whole-mount in situ hybridization. (Scale bars: A, 250 μm; C, 150 μm; and H, 50 μm.) EXPRESSION / LABELING:
|

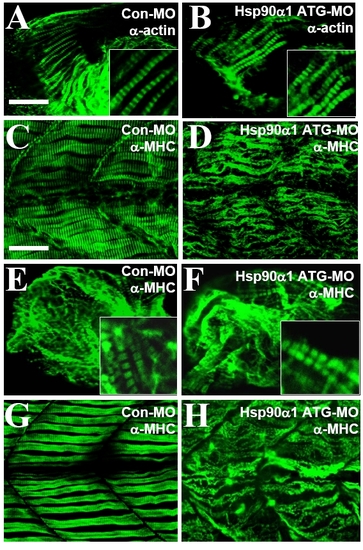
Knockdown of Hsp90α1 expression resulted in myofibril disorganization in skeletal muscles of zebrafish embryos. (A and B) Anti-MHC antibody (F59) staining shows the organization of thick filaments in trunk slow muscles of control-MO (A) or Hsp90α1-ATG-MO (B) injected embryos at 24 hpf. (C and D) Anti-MHC antibody (F59) staining shows the organization of thick filaments in trunk slow muscles of Hsp90α2 ATG-MO (C) or Hsp90α1-E3I3-MO (D) injected embryos at 24 hpf. (E and F) Anti-actin antibody staining shows the organization of thin filaments in control-MO (E) or Hsp90α1-ATG-MO (F) injected embryos at 24 hpf. (G and H) Anti-α-actinin antibody staining shows the organization of the Z-line in control-MO (G) or Hsp90α1-ATG-MO (H) injected embryos at 24 hpf. (I and J) Anti-myomesin antibody staining shows the organization of the M-line in control-MO (I) or Hsp90α1-ATG-MO (J) injected embryos at 72 hpf. (Scale bars: A and B, 25 μm and I, 15 μm.) PHENOTYPE:
|

Knockdown of Hsp90α1 results in MHC degradation and up-regulation of unc-45b expression. (A) Western blot analysis shows the low levels of MHC proteins in Hsp90α1 knockdown embryos. In contrast, expression levels of actin and myogenin were not affected. (B) RT-PCR analysis of fast-muscle MHC (fMHC), slow-muscle MHC (sMHC), unc-45b, Hsp90α1, and ef-1α expression in control (lanes 1, 3, 5, 7, and 9) or Hsp90α1 ATG-MO injected (lanes 2, 4, 6, 8, and 10) embryos. (C–F) Side views (C and E) or cross-sections (D and F) show unc-45b expression in control (C and D) or Hsp90α1 ATG-MO (E and F) injected embryos at 24 hpf. EXPRESSION / LABELING:
|
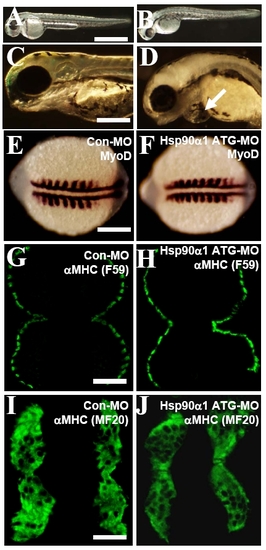
Knockdown of Hsp90a1 expression had no effect on myoblast specification and early differentiation of slow and fast myofibers. (A and B) Morphological comparison of control-MO (A) or Hsp90a1-ATG-MO (B) injected embryos at 48 hpf. The Hsp90a1 knockdown embryos appeared morphologically normal except for the lack of locomotion and muscle contraction. (C and D) Compared with control, high dose (10 ng) of Hsp90a1 ATG-MO injection induced edema in zebrafish embryos at 72 hpf (D). (E and F) In situ hybridization showing normal MyoD expression in control-MO (E) or Hsp90a1-ATG-MO (F) injected embryos at 14 hpf. (G and H) F59 antibody immunostaining on cross-sections showing expression of myosin in slow muscles of control-MO (G) or Hsp90a1-ATG-MO (H) injected embryos at 24 hpf. (I and J) MF-20 antibody staining showing expression of myosin in both fast and slow myofibers of control-MO (I) or Hsp90a1-ATG-MO (J) injected embryos at 24 hpf. (Scale bars, 250 mm in A, 50 mm in C, 150 mm in E, 75 mm in G and I.) EXPRESSION / LABELING:
PHENOTYPE:
|
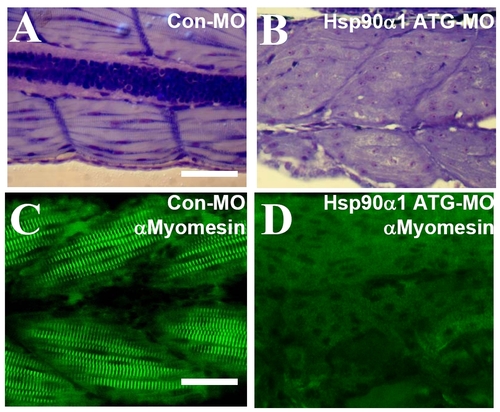
Knockdown of Hsp90a1 results in myofibril disorganization in fast muscles. (A and B) Toluidine staining on longitudinal sections showing highly organized myofibrils in fast muscles of control-MO injected embryos (A), or disorganized myofibrils in Hsp90a1 knockdown embryos (B) at 72 hpf. (C and D) High magnification showing the M-line organization in fast muscles revealed by anti-myomesin antibody in control-MO (C) or Hsp90a1 ATG-MO (D) injected embryos at 72 hpf. (Scale bars, 25 mm.) PHENOTYPE:
|

Knockdown of Hsp90a1 expression did not affect MHC mRNA levels. (A-D) Side and cross views of fMHC expression in control (A and B) or Hsp90a1 ATG-MO (C and D) injected embryos at 24 hpf. (E-H) Side and cross-section views of sMHC expression in control (E and F) or ATG-MO (G and H) injected embryos at 24 hpf. EXPRESSION / LABELING:
|
Knockdown of Hsp90a1 expression did not affect myofibril organization in cardiac muscles. (A and B) Anti-MHC antibody (F59) staining shows the organization of thick filaments in cardiac muscles of control-MO (A) or Hsp90a1 ATG-MO (B) injected embryos at 72 hpf. (C and D) Anti-MHC antibody (F59) staining shows the organization of thick filaments in trunk skeletal muscles of Co-MO (C) or Hsp90a1 ATG- MO (D) injected embryos at 72 hpf. (E and F) Anti-actin antibody staining shows the organization of thin filaments in cardiac muscles of control-MO (E) or Hsp90a1-ATG-MO (F) injected embryos at 72 hpf. (G and H) Anti-a-actinin antibody staining shows the organization of thin filaments in skeletal muscles of control-MO (G) or Hsp90a1-ATG-MO (H) injected embryos at 72 hpf. (Scale bars, 25 mm.) PHENOTYPE:
|